
Note: Please note that this user manual may not always reflect the current state of the software version. With software updates, it may happen that the present description is no longer accurate in some points. In this case, please contact us directly or use the current version of the user manual, which you can find on our website www.a-eberle.de.
Publisher:
A. Eberle GmbH & Co. KG
Frankenstraße 160
D-90461 Nuremberg
Phone: +49 911 62 81 08 0
Fax: +49 911 62 81 08 99
Email: info@a-eberle.de
Internet: www.a-eberle.de
The company A. Eberle GmbH & Co. KG assumes no liability for damages or losses of any kind resulting from printing errors or changes in this user manual.
Likewise, the company A. Eberle GmbH & Co. KG assumes no liability for damages and losses of any kind resulting from the use of the software or from devices modified by the user through the software.
Copyright 2025 A. Eberle GmbH & Co. KG. All rights reserved.
The user manual summarizes all important information for installation and operation. Read the user manual completely and only use the product once you have understood the user manual.
This user manual is intended for trained professionals as well as trained and certified operating personnel. The content of this user manual must be made accessible to the persons responsible for the installation and operation of the system.
Structure of the warnings
Warnings are structured as follows:
| Type and source of danger! | |
 | Consequences of non-compliance. |
| Signal word |
Grading of the warnings
Warnings differ according to the type of danger as follows:
| Warns of an imminent danger that will result in death or serious injury if not avoided. |
| Danger |
 | Warns of a potentially dangerous situation that will result in moderate or minor injury if not avoided. |
| Warning |
 | Warns of an imminent danger that will result in death or serious injury if not avoided. |
| Caution |
 | Warns of a potentially dangerous situation that will result in property or environmental damage if not avoided. |
| Note |
 | Tips for proper handling of the software and recommendations. |
| Note |
Instructions
Structure of the instructions:
![]() Instruction for an action.
Instruction for an action.
![]() Result indication if necessary.
Result indication if necessary.
Lists
Structure of bulleted lists:
Level 1
Level 2
Structure of numbered lists:
Level 1
Level 1
Level 2
Level 2
For the safe and correct use of the software, also observe the additionally supplied documents as well as relevant standards and laws.
Keep the user manual, including the applicable documents, readily available near the system.
Installation file
License agreements
License file (JSON file)
WebPQ® database software including PostgreSQL database for fully automated processing and evaluation of power quality data in your IT environment! Basic versions always include 3 units – unlimited expansion possible via add-ons.
Automated reading of measurement data from PQI-LV / PQI-DA smart and PQI-DE devices via SSH and CCCI interface
Web server for visualizing measurement data and disturbance records in level-time diagrams / histograms / bar charts / vector diagrams / ITIC / and more
Responsive live data display from one or more devices simultaneously
Automated alarm management in case of disturbances
Automated reports according to EN50160 and IEC61000-2-2 / IEC61000-2-4 / IEC61000-2-12, switchable to up to 65 standard templates
Parameterization and management of measuring devices via the web server
IT security through a comprehensive user rights management system with audit logging, password policies, and more
Visualization of measurement data from PQI-D and PQI-DA devices
Integration of WinPQ into WebPQ® to support PQI-Ds
CSV and Comtrade export functionality
| License Type | Description | Article Number |
|---|---|---|
| WebPQ Basic | incl. 3 units for up to 30 units with basic functionality | L.900.9266.10 |
| WebPQ Professional | incl. 3 units for up to 100 units with professional functionality | L.900.9266.20 |
| WebPQ Enterprise | incl. 3 units for systems > 100 units with enterprise functionality | L.900.9266.30 |
WebPQ Initial Order - Number of Units
| Number of Units | Article Number |
|---|---|
| 10 Units | L.900.9266.1010 |
| 30 Units | L.900.9266.1025 |
| 50 Units | L.900.9266.2050 |
| 100 Units | L.900.9266.2100 |
| 500 Units | L.900.9266.3500 |
| 1000 Units | L.900.9266.3599 |
Available WebPQ Add-ons
| Add-on Name | Article Number |
|---|---|
| WebPQ Add-on "Fleet Management" | L.900.9265.32 |
| WebPQ Add-on "Nequal Export" | L.900.9265.34 |
Additional Units
| Number of Units | Article Number |
|---|---|
| WebPQ Add-on 10 Units | L.900.9266.60 |
| WebPQ Add-on 50 Units | L.900.9266.61 |
| WebPQ Add-on 100 Units | L.900.9266.62 |
Maintenance Agreements
| Maintenance Agreement | Article Number |
|---|---|
| WebPQ Maintenance Agreement Annual | L.900.9066.10.01 |
| WebPQ Maintenance Agreement One-time | L.900.9066.10.02 |
Publisher:
A. Eberle GmbH & Co. KG
Frankenstraße 160
D-90461 Nuremberg
Windows 10 64-bit
Windows 11
Windows Server 2016
Windows Server 2019
Windows Server 2022
Windows Server 2025
WebPQ: Chrome, Firefox, Microsoft Edge, Safari
PostgreSQL 14.*
MS-SQL (ab Version 2022)**
*PostgreSQL is supported from WinPQ > 6.2. **Individual order process and license key are necessary! Consultation required.
If WebPQ is to be operated with MS-SQL, the MS-SQL server must be configured to support Mixed-Mode Authentication. This is necessary so that WebPQ can access the database. Alternatively, a Windows user with appropriate permissions can be used for database access. This user must then be stored as a user in the WebPQ service.
CPU: 4 cores
RAM: 8 GB memory
Storage: two partitions - 20 GB for WebPQ installation and an additional 1 GB per year per connected measuring device (using standard profiles)
Network: Ethernet adapter for communication with TCP/IP PQ devices
Display: Remote desktop connection or monitor with at least 1280 x 1024 pixel resolution
Browser: Chrome, Firefox, Microsoft Edge, Safari
SMTP Mail Server: acces to a mailserver from the application for alerting, notifications, and user management
Hardware: Server designed for 24/7 operation / Virtual server system (more cost-effective!)
CPU: CPU with 6 or more cores
RAM: 8 GB or more memory
Storage: two partitions - 20 GB for WebPQ installation and an additional 1 GB per year per connected measuring device (using standard profiles) with redundancy and automatic backup
Disk: Solid-state disk for the database on a second partition
Network: Ethernet adapter with high data throughput for communication with TCP/IP devices
Display: Remote desktop connection or monitor with high resolution (e.g., 1920 x 1200 pixels)
Browser: Chrome, Firefox, Microsoft Edge, Safari
SMTP Mail Server: acces to a mailserver from the application for alerting, notifications, and user management
Running WebPQ in a terminal server environment is technically possible, but generally not required, as WebPQ is provided as a web application via an integrated web server. Installation is performed directly on the terminal server; the configuration directory is stored by default in the system folder %programdata%.
Administration Notes:
Initial configuration and administrative adjustments of the WebPQ backend application should only be performed by a user with local administrator rights via remote desktop connection. This ensures that configuration changes are made consistently and securely.
Access rights to the configuration directory should be assigned restrictively to prevent unauthorized changes by other users.
User Access Model:
Use of WebPQ (user management, device management, data analysis, and other functions) is exclusively via a web browser. Users do not require direct access to the terminal server or backend application, but connect to the WebPQ web interface over the network.
The terminal server environment does not affect operation of the web interface. Users can access WebPQ from any supported device (PCs, notebooks, thin clients) with a compatible browser.
Simultaneous access by multiple users to the web interface is possible, as WebPQ is designed for multi-user operation.
Access to the web interface is via the web server URL, which is provided to users—this can, if necessary, also be local to the terminal server (e.g., https://localhost:8443).
Technical Recommendations:
The terminal server must have sufficient resources (CPU, RAM, network bandwidth) for running WebPQ and any additional applications.
Permissions and security settings of the %programdata% directory should be reviewed.
Network configuration and firewall rules must allow access to the WebPQ web server; the path to the web interface should be communicated to users.
For optimal performance, use the latest browser versions on client devices.
PDF reader
Installed browser: Chrome, Firefox, Microsoft Edge, Safari
Database tools such as DBeaver (universal for all supported databases) or PG Admin for PostgreSQL
for the WebPQ WebServer: SSL certificate for secure communication in PEM format - see Information about the SSL Certificate of the WebPQ Web Server
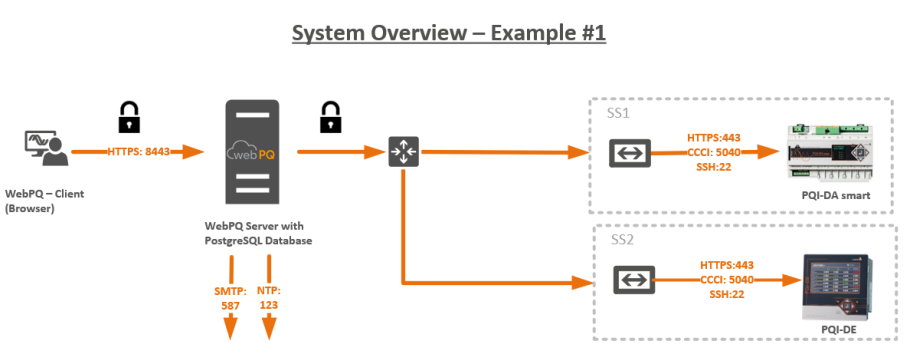
WebPQ Server
Virtual machine or PC where WebPQ runs as a service along with the database (PostgreSQL).
WebPQ Client
Host where the actual analysis of measurement data and management of measuring devices takes place via a browser. This host is often found in the office network.
SMTP Server
Mail server necessary for alerting and functions such as password reset, system messages, and automated alerting.
NTP Server
NTP server for synchronizing devices and the WebPQ server.
| It is also possible to install the database on another server! |
| Note |
Required Port Numbers for Communication:
Releases in gateways and firewalls must be configured from row to column (e.g., from the WebPQ Client, port 8443 - HTTPS must be enabled to the server to allow data usage on the client).
| WebPQ Server | WebPQ Client | Database Server | PQI-D (REG-COM) | PQI-DA smart / PQI-DE / PQI-LV | NTP Server | SMTP Server | Webserver of Device PQI-DA smart / PQI-DE / PQI-LV | |
|---|---|---|---|---|---|---|---|---|
| WebPQ Server | x | x | 5432 PostGre, 3306 MySQL | 8000 TCP, 1111 TCP | 5040 TCP-CCCI, 22 SSH | 123 NTP | 587 STARTTLS, 465 SSL/TLS | 8443 HTTPS |
| WebPQ Client | 8443 HTTPS, 1701 … 170X ParaPQID | x | x | x | x | x | x | x |
| Database Server | x | x | x | x | x | x | x | x |
| PQI-D (REG-COM) | x | x | x | x | x | x | x | x |
| PQI-DA smart / PQI-DE / PQI-LV | x | x | x | x | x | 123 NTP | x | x |
| NTP Server | x | x | x | x | x | x | xx | x |
| SMTP Server | x | x | x | x | x | x | x | x |
| Webserver of Device PQI-DA smart / PQI-DE / PQI-LV | x | x | x | x | x | x | x | x |
* 1701...170X: Range for specific ports for PQI-Ds, depending on configuration.
Typical Data Volumes in Communication
Connecting a measuring device to the WebPQ database generates approximately 20 MB per week in the standard configuration. Since the readout process is continuous, the data transfer requires a minimum speed of only 200 kbit/s.
The following checklist is used to collect system information and requirements for the WebPQ installation to ensure smooth and fast service. Please fill in the relevant fields and send the completed checklist to your contact at A. Eberle.
Are you already using WinPQ?
☐ Yes ☐ No
Which WinPQ version are you currently using? ______________________
Please provide your WinPQ license number or license details: ______________________
Which database type are you currently using?
☐ MSSQL ☐ MySQL ☐ PostgreSQL ☐ Other: _____________
Which version of the database is in use? ______________________
What is the size of your database (in GB)? ______________________
Where is your database located?
☐ Local ☐ Server ☐ Other: _____________
Do you have a backup routine in place?
☐ Yes ☐ No
If yes, please briefly describe where the backups are stored: ______________________
For a smooth process, please create a complete system backup (snapshot/backup) before installation. Please confirm: ☐ Yes ☐ No
How many devices are integrated into the system? ______________________
Which device types do you use?
☐ PQI-DA Smart
☐ PQI-DA DE
☐ PQI-DA LV
☐ PQI-D
☐ PQI-DA
How many users will work with the system? ______________________
Note: The sum of devices and users determines the required number of units for WebPQ. If you have any questions, please contact your A. Eberle representative.
Is an NTP server available? ☐ Yes ☐ No - IP address: ___________
Does your server meet the current system requirements for WebPQ? See System Requirements ☐ Yes ☐ No
Which operating system is installed on the server? ______________________
Have the required ports for communication with the WebPQ database and devices been enabled?
☐ Yes ☐ No
If yes, please specify which ports have been enabled: ______________________
Is it a physical or virtual server?
☐ Physical ☐ Virtual
What type of hard drive is installed in the server?
☐ SATA ☐ SSD
Is the server joined to a domain? ☐ Yes ☐ No
Is the server designed for 24/7 operation? ☐ Yes ☐ No
Is an SMTP server available for alerts and user management? Recommended function
☐ Yes ☐ No
Are the access credentials available? ☐ Yes ☐ No
Server address: ______________________
Port: ______________________
Username: ______________________ (Required for commissioning – please do not provide here!)
Password: ______________________ (Required for commissioning – please do not provide here!)
Encryption: ☐ TLS ☐ SSL ☐ None
Which partitions are available on the server (e.g., C:, D:, etc.)? It is recommended to store the database and temporary files on separate partitions. C: Size: _______________ D: Size: _____________
Is a server migration planned or desired?
☐ Yes ☐ No
Do you want to integrate new devices into the system?
☐ Yes, number ______ ☐ No
Is remote access via TeamViewer or another tool possible?
☐ Yes ☐ No
Are the access credentials available? ☐ Yes ☐ No
The following notes describe general basics for secure WebPQ operation. The complete administrative IT security review is intentionally documented in a separate handbook that is provided separately on request.
Follow the operating manual and keep it available during installation, operation, and maintenance.
Ensure that only trained personnel install, administer, and service WebPQ.
Operate the application only in a controlled system environment.
Back up the installation regularly and validate recovery.
Keep the operating system, browser, database, and WebPQ itself on a current patch level.
| For information on patch management and for the separate WebPQ IT security documentation, please contact your sales partner or support. |
| Note |
The product WebPQ is exclusively used for the evaluation of Power Quality measurement data and energy measurement data in the power grid at low, medium, and high voltage levels. If the software is used in a manner not specified by the manufacturer, it may potentially cause damage!
The installation of WebPQ is carried out in several steps, including installation, administrative configuration, and initial setup. As of 2025, with WebPQ taking over many functions from WinPQ, various installation options and operating modes are available.
This option is suitable if the basic functions of WebPQ, which continue to evolve, are sufficient and there are no special requirements for export formats or integration of devices from the classic platform (PQI-D / PQI-DA).
Secure operation requires that this installation handbook is used together with the separate WebPQ IT security documentation. That separate document is provided for administrative and organizational security review.
Required if PQI-D or PQI-DA (see illustration in the software) needs to be integrated.
Required if special reports from WinPQ are needed.
Required if special exports, such as PQDIF, are necessary.
Required if PQ Box data needs to be imported into the database.
WinPQ software is always included in the license and delivery of WebPQ software and can be selected or deselected during installation.
A separate uninstallation assistant is available for uninstalling WinPQ software, which is described here.
| Please make sure to check the compatibility information and versions of the supported databases in the chapter System Requirements |
| Hint |
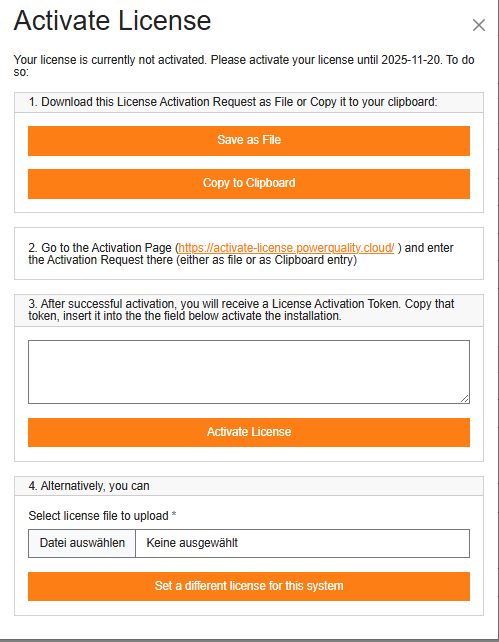
Starting with WebPQ version 2.1 the installation must be activated with an Activation Key. Until activation a notice dialog or the activation window is shown at the top. The software can be used for a maximum of 30 days without activation; within this period the Activation Key must be applied.
The activation file is generated using the hardware ID of the host and is only valid on this host. No direct internet connection is required for activation, but you must transfer a file from the host to another PC with internet access to activate the key at https://activate-license.powerquality.cloud/.
If the host hardware changes later, the stored activation is no longer valid and the activation process must be repeated. In that case, support may first need to reset the previous activation.
Proceed as follows:
Download the file LicenseActivationRequest.json via the button Save to file or copy its content via the button Copy to clipboard.
Open https://activate-license.powerquality.cloud/ and submit the activation request (either upload the file or paste the copied content).
After successful activation you receive an activation token for the license. Copy this token and paste it into the field to activate the installation, or alternatively use the file selection dialog to choose the activation file you downloaded from the activation page.
If you plan a system migration or the host hardware changes, a new activation is required. Repeat the process described above. For questions contact our support at pqsys-support@a-eberle.de.
For later license replacement, renewal, or reactivation details inside the running application, see the License Management chapter.
WebPQ Installation with Database (PostgreSQL) - Standard Case
The PostgreSQL database is installed directly on the host along with the WebPQ application. This installation type is particularly recommended for small to medium-sized systems (up to 200 devices). The PostgreSQL database is also installed during setup. Individual directory structures can be adjusted during installation.
WebPQ Installation Without Database and Connection to an Existing Database or Installation of a PostgreSQL Database on a Dedicated Server
This option is suitable if an existing database infrastructure is to be used or if the PostgreSQL database is installed on a separate server.
WebPQ Installation with Parallel WinPQ Installation with or Without a Database
This installation type should be selected if WinPQ software functions need to be retained. It must be decided which instance (WinPQ or WebPQ) will handle communication with the devices.
The WebPQ software is delivered securely via our portal https://software.a-eberle.de using a dedicated one-time access with SHA256 hash sum verification. Please verify the checksum for security purposes.
Secure installation also includes reviewing the intended target architecture, communication paths, permission model, and the requirements described in the separate WebPQ IT security documentation.
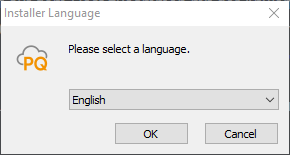
The installation process starts by double-clicking the "WebPQ_Setup_x.y.z.exe" file. The installation must be confirmed in the User Account Control with "YES." Next, a language selection for the assistant must be made.
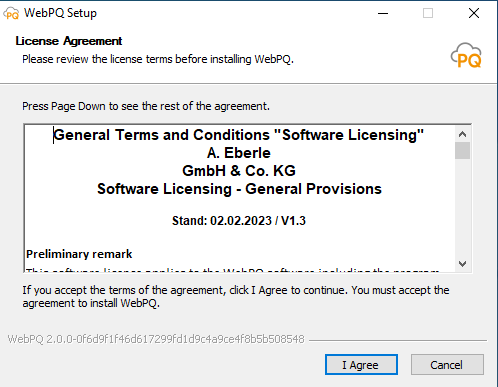
Acceptance of the license terms is required. More details on the terms and maintenance contract can be found in the delivery documents.
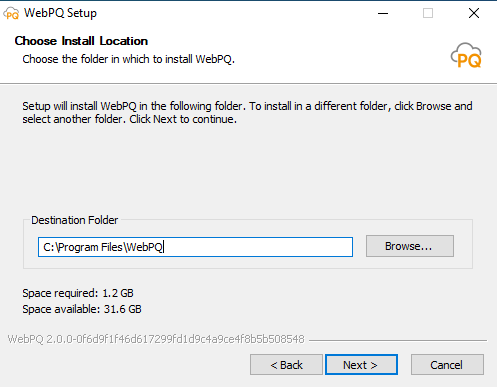
A target directory for installation can be specified. All necessary operational data will be stored in this directory. User-specific data can be found in %programdata%/aeberle/webpq.
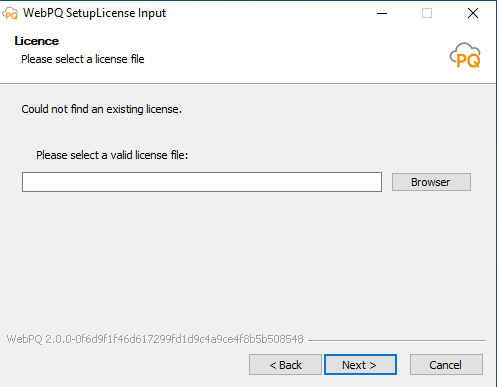
A license file is required for the software to operate. This JSON-format file is provided during initial delivery or with a maintenance contract. The JSON file can be selected via "Browse" and is validated by the assistant. If the file is lost, please contact A. Eberle with your order and customer number.
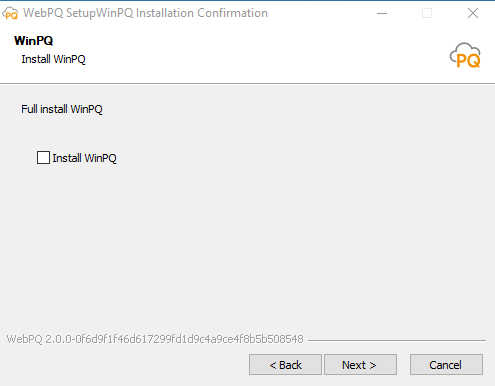
If the WinPQ software is to be installed, it must be selected here. Information on why this might be necessary can be found under Operating WinPQ Software Parallel to WebPQ.
The appropriate mode must be selected based on the Installation Variants.
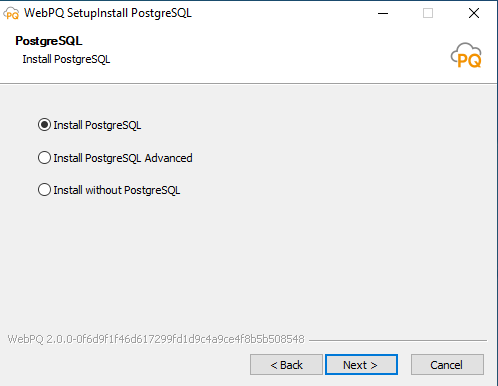
Install PostgreSQL
In this mode, the following steps are performed:
The PostgreSQL database is installed with the following default parameters:
| Parameter Name | Value |
|---|---|
| Directory | C:\ProgramFiles\ WebPQDatabase |
| Port | 5432 |
| Database Service Name | WebPQDatabase |
| WebPQ Server Service Name | WebPQServer |
| WebPQ Client Service Name | WebPQClient |
The database is installed with the following default passwords and users:
| Role | Username | Password |
|---|---|---|
| Administrator | PQDBA | admin |
| User | PQID | PQID |
| The default passwords should always be changed to avoid significant security risks. It is recommended to use the advanced installation to set custom passwords. |
| Note |
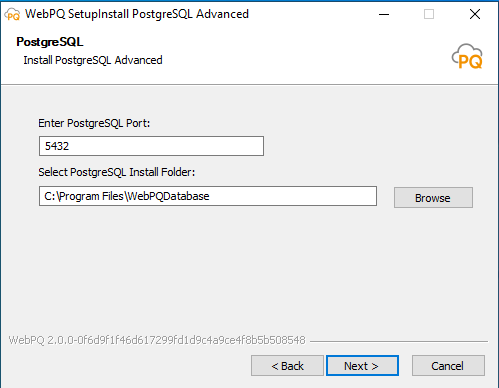
In this mode, PostgreSQL is installed with custom settings:
Port number for database access
Target directory for the database (e.g., on another drive like an SSD)
Custom usernames and passwords for "Database Administrator" and "Database User"
This mode is suitable if an existing database is used, either running on another server or already available on the host. After completing the assistant, the following connection details must be available. Pay attention to case sensitivity in parameter names!
Database name
Username with database access
Password for the database user
Database schema name
For installations with a dedicated PostgreSQL server, an additional continuously updated backup mirror can be set up. In this setup, a second PostgreSQL server runs as a replica of the production system.
A replication server increases resilience, but it does not replace a classic backup strategy.
The recommended setup is therefore a combination of:
one primary server for production,
one backup server as a continuously updated mirror,
and additional classic backups for retention, version history, and restoration of older data states.
Replication helps protect against server or hardware failure. Classic backups additionally protect against operator errors, logical data errors, and accidental deletion of data that would otherwise also be replicated.
You need:
one primary server with PostgreSQL and WebPQ,
a second backup server or virtual machine,
PostgreSQL on both systems,
a working network connection between the two servers,
and an administrator with PostgreSQL knowledge.
The backup server is a continuously updated copy of the primary server. Changes from the production system are transferred automatically. During normal operation, the backup server is read-only.
Server A = Primary server / production system
    -> WebPQ application
    -> PostgreSQL primary database
    -> active write operations

Server B = Backup server / mirror
    -> PostgreSQL replica
    -> continuous transfer of changes from Server A
-> read-only operation during normal useOn the primary server, open the file postgresql.conf and set at least the following values:
wal_level = replica
max_wal_senders = 5
Then open the file pg_hba.conf and allow replication access for the backup server or the corresponding network. Example:
host replication replicator 192.168.1.0/24 md5Then create a user for replication:
CREATE ROLE replicator WITH REPLICATION LOGIN PASSWORD 'password';Restart PostgreSQL on the primary server afterward.
Stop PostgreSQL on the backup server.
Then clear the PostgreSQL data directory on the backup server. No old data residue should remain there.
After that, copy the database base state from the primary server using pg_basebackup:
pg_basebackup -h SERVER_A_IP -D /var/lib/postgresql/data -U replicator -P -RReplace SERVER_A_IP with the address of the primary server and adjust the target directory to your PostgreSQL installation.
Start PostgreSQL on the backup server. Synchronization begins automatically after startup.
On the primary server, the replication status can be checked, for example, with:
SELECT * FROM pg_stat_replication;If the backup server appears there as an active connection, replication is running.
Changes on the primary server are transferred automatically to the backup server.
The backup server remains read-only during normal operation.
The backup server is intended as a failover reserve and not as an additional working server.
If the primary server fails, the backup server can be manually promoted to the new primary server:
pg_ctl promoteAfter that, the former backup server continues operating independently as the primary server.
There is no automatic failback to the original primary server. If the old primary server is to be used again later, it must be set up again as a replica or as a new primary system.
Streaming replication does not replace regular file-based backups or PostgreSQL backups.
Before updates and larger system changes, additional backups should still be created.
For sizing, architecture, or recovery strategy questions, coordinate the database configuration with your IT department or system integrator.
The WebPQ must be initially set up with an administrator in the application layer and certain basic settings such as global password policies. The initial setup must always be performed when a new database connection to an existing WinPQ database is created in the administrative layer! Normally, the initial setup dialog appears automatically after the installation.
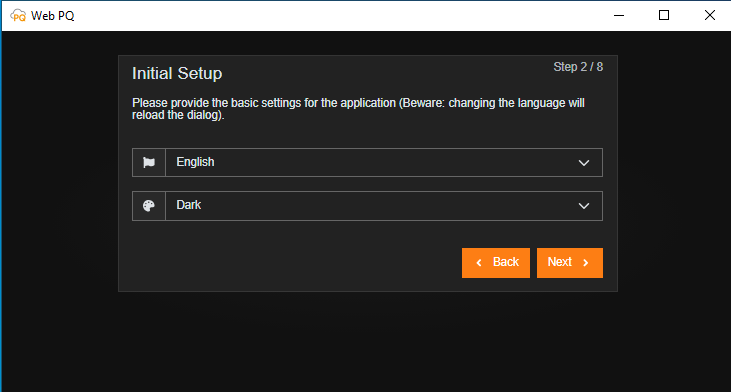
The basic settings are divided into eight areas:
Welcome page
Language and layout
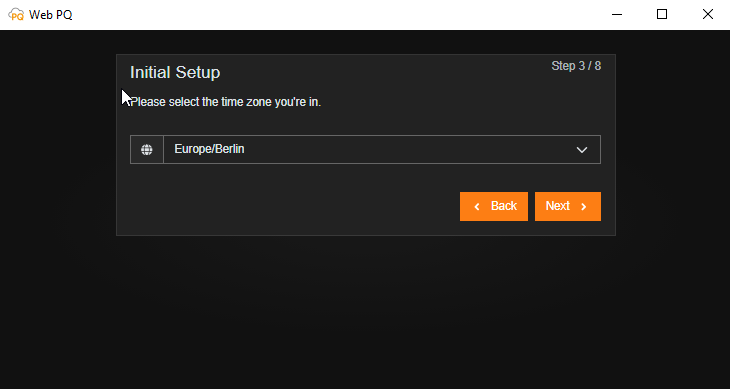
Time zone setting
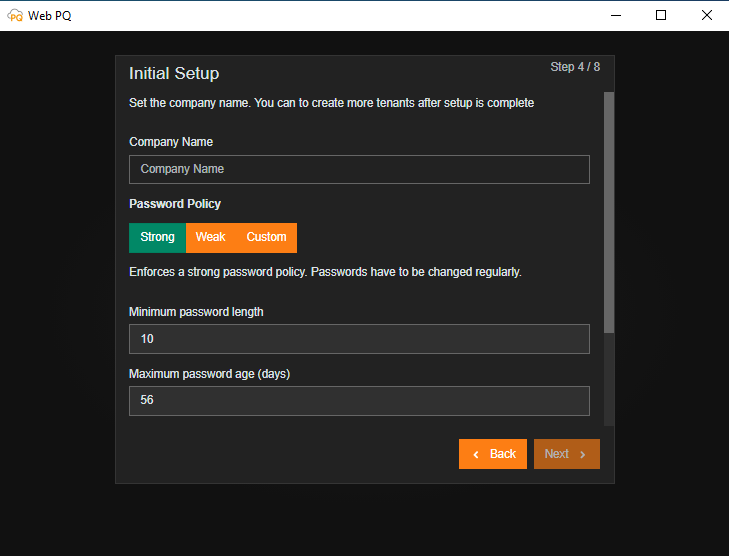
Password policy
User identification and data
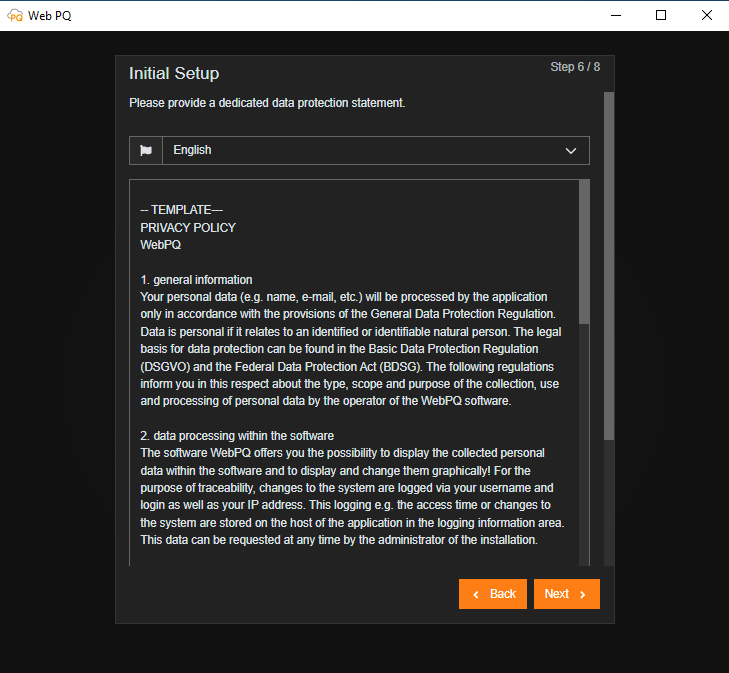
Privacy policy
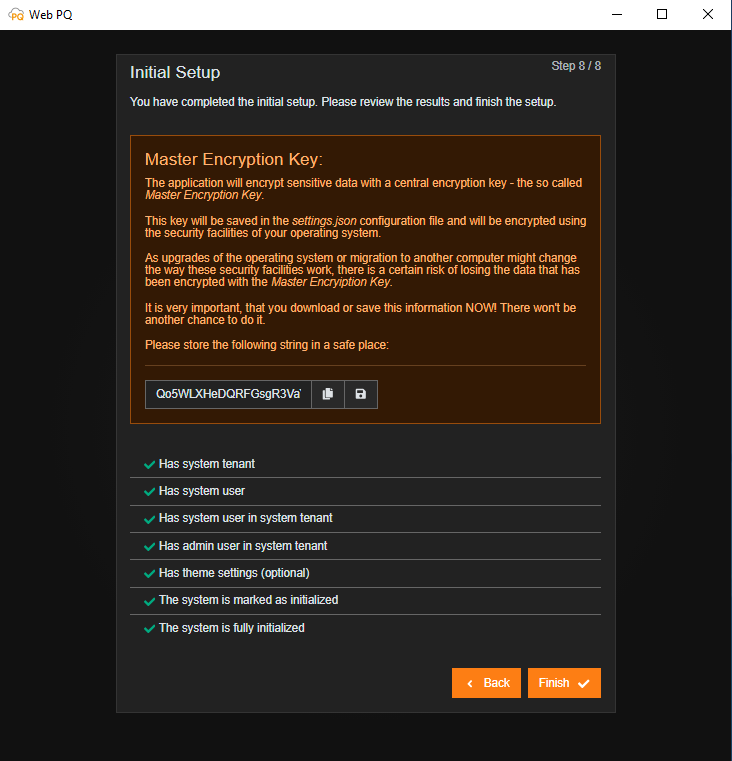
Backup of the encryption key
Summary
Data adoption
Explanations of the sub-areas:
The language and layout are stored in the user account but can be adjusted again after login.
The user's time zone must be set to display times correctly in different time zones. Each measuring point also receives its own individual time zone. The user can choose between different time zone views.
In the area of KRITIS, password policies per company are usually set by central IT. The setting here applies to all created passwords within the further administration. The setting can be changed individually afterward. See also: Tenant Settings
The following settings are possible:
Minimum password length
Password expiration time
Number of lowercase letters
Number of uppercase letters
Number of special characters
Number of digits
Here, the main administrator of the system is defined. The used passwords must be kept secure. Recovery of the root account is only possible with data loss.
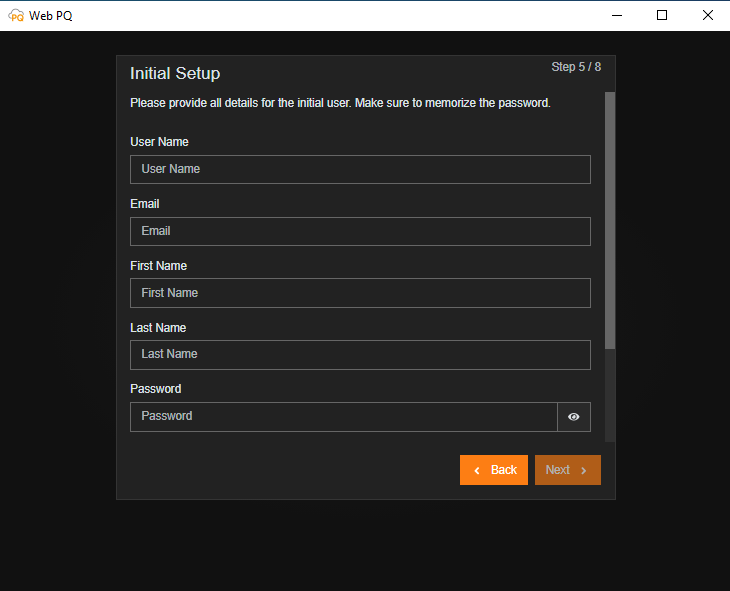
| The entered administrative password must be kept secure and must not be lost! Recovery without data loss is not possible! |
| Note |
The static Swagger and OpenAPI assets of WebPQ are not public download URLs. The customer API description at /swagger.html, /swagger.json, and /integration-swagger.json requires an authenticated WebPQ session or a valid bearer token.
For administrators and developers this means:
open the developer documentation from inside the authenticated WebPQ application when you need the current API entry points,
use the shown Swagger UI or JSON description only after login or with an explicit API token,
optional public user documentation in a deployment does not make the Swagger or API endpoints public.
If an SMTP server is configured in the advanced settings, the password can be recovered using the password reset function with the entered email address.
Information on password reset can be found under: Forgot Password
If you want to create an individual privacy agreement for your employees or customers, you can do so directly here. The software logs the required information automatically on the server as per the requirements, e.g., from the BDEW whitepaper.
Information on audit logging can be found under: Audit Logging
The application encrypts sensitive data with a central encryption key using the AES-256-CBC method, known as the Master Encryption Key. This key is stored in the configuration file settings.json and is encrypted with the security functions of your operating system. Since the functionality of these security features may change due to operating system upgrades or migration to another computer, there is a certain risk of losing data encrypted with the Master Encryption Key. It is very important that you download or securely store this information NOW! There will be no further opportunity to do so.
After all data has been entered, it is transferred to the database, and the application is restarted.
The WebPQ software is usually installed together with a locally running PostgreSQL database. Therefore, both the software and the database must be uninstalled in two separate steps if necessary.
The uninstallation of WebPQ software is done through the Windows built-in uninstallation assistant. This can be accessed either through the Control Panel or by searching in the Windows Start menu.
The database must be uninstalled through the Windows Services Management. The "WebPQDatabase" service must be stopped and removed. Then, the database files can be manually deleted.
Follow these steps:
Open the Windows Services Management.
Stop the "WebPQDatabase" service.
Uninstall the "WebPQDatabase" service.
Delete the database files in the database installation directory (default: C:\Program Files\WebPQDatabase).
Alternatively, the uninstallation can also be done via the command line. Open the command line with administrator rights and enter the following commands:
sc stop WebPQDatabase
sc delete WebPQDatabaseThe WebPQ software stores temporary files and exported files in the directory %programdata%/aeberle/webpq. These files can be manually deleted after uninstalling the software. However, ensure that no important data is lost. Similarly, files of exports and reports may be stored in directories set within the application. These should also be deleted.
The administrative interface or backend may open with pre-configured connection settings during the initial installation. It can be accessed anytime on the host via the taskbar (next to the clock) by right-clicking the "WebPQ" icon and selecting "Administration."
During the initial setup of the software, usually only the hostname of the database server, the database name, and the username and password of the database need to be configured in the "Database" section. If the database is installed on the same host as the WebPQ software, the default values can usually be retained.
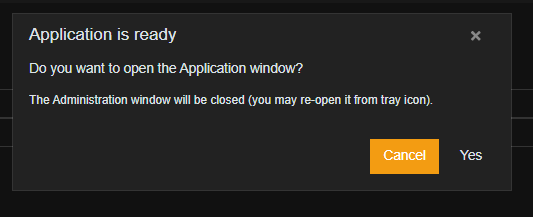
After correctly entering all settings, the processes restart by clicking the "Update" buttons. Then, you will be asked if the application should be started with the embedded web browser. Clicking "Yes" opens the frontend in the app.
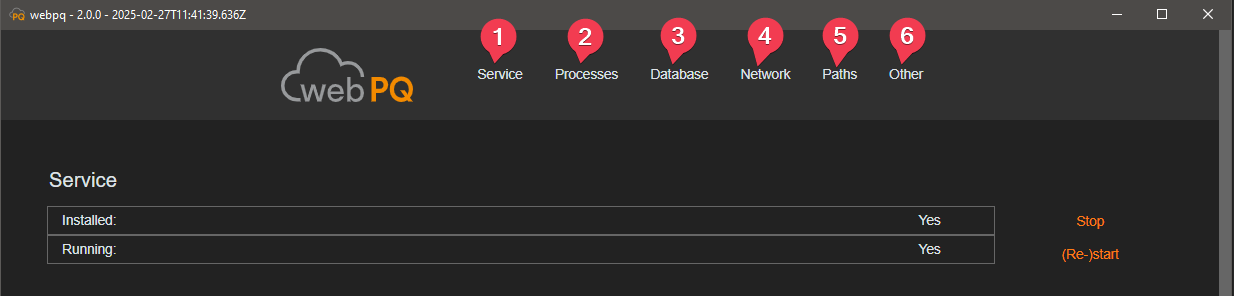
The administrative interface itself is generally divided into six main areas, which can be accessed by clicking on the name.
In the "Service" section, the user can monitor (#1), restart (#2), and stop (#3) the status of the background services "WebPQService.exe," which runs under the "System" account.

Generally, the service that provides the web server for the clients should be both installed (Installed: YES) and continuously running (Running: YES).
The service starts automatically when the host starts and runs in the background. It is responsible for communication between the clients and the web server.
The "Processes" section shows the running processes of the software. Here, the processes can be monitored and restarted if necessary.

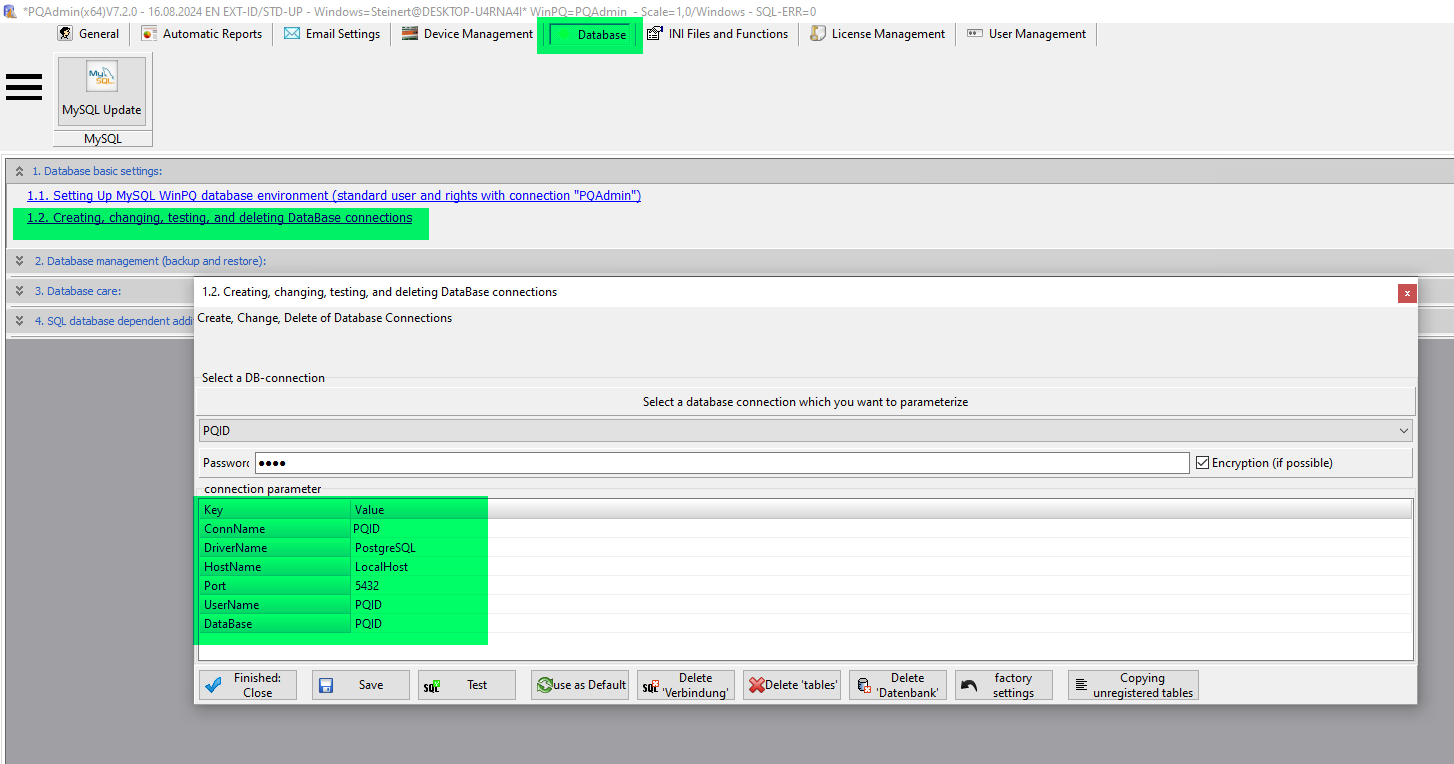
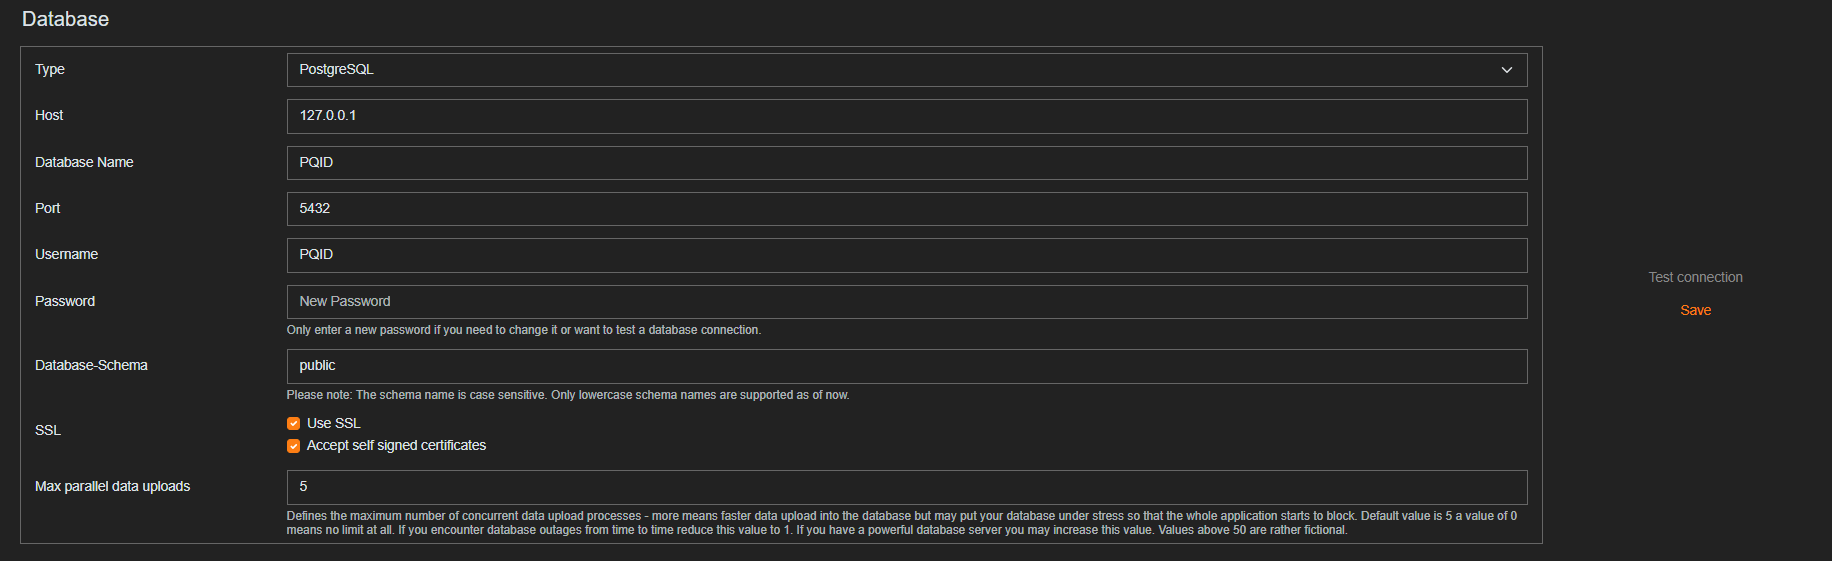
The settings in the database section are necessary to establish a connection with the database server. The database connection settings can be found in WinPQ under "System Management >> Database" if an existing WinPQ database is to be used for WebPQ.
| Parameter | Description |
|---|---|
#1 Type | Specifies the type of database used (MySQL / MariaDB, PostgreSQL & MS-SQL) 2 |
#2 Host | Specifies the IP address / hostname of the server where the database is running |
#3 Database Name | Name of the database where the measurement data is stored and where the WebPQ settings are also stored. |
#4 Port | Specifies the TCP port under which the database server from #2 is reachable |
#5 Username | Username with necessary write permissions on the database specified in #3 |
#6 Password | Specifies the password for the database connection user. The password is stored encrypted in the Windows Security Storage in the system user. For security reasons, it is not possible to read back the password in the interface! A password should only be entered when necessary changes are made! |
#7 Database Schema | WebPQ stores data such as user settings, analyses, and many others in schemas. The default value here is always "public" |
#8 SSL | The connection to the database server is generally encrypted (checkbox checked). |
#9 Self Signed certificates | The supplied certificates of the databases are by default "self signed." However, these can be replaced by company-specific certificates. |
#10 Max parallel data uploads | Sets the maximum number of parallel uploads to the database! By default, 5 is selected here. For large systems with high-performance databases, the number can be increased! |
#11 Test connection | Checks if a connection to the database can be established with the entered data (e.g., if ports are open and all entered data is correct for a connection) |
#12 Update | Saves the settings and restarts the services and processes if changes are made! |
| For MSSQL databases, the database schema dbo should be used. |
| Note |
For a connection to a WinPQ system installed with its default settings, the following settings should be used.
| Parameter | Value |
|---|---|
#1 Type | MySQL / MariaDB |
#2 Host | localhost |
#3 Database Name | PQID |
#4 Port | 3306 |
#5 Username | PQID |
#6 Password | PQID |
| Parameter | Value |
|---|---|
#1 Type | PostgreSQL |
#2 Host | localhost |
#3 Database Name | PQID |
#4 Port | 5432 |
#5 Username | PQID |
#6 Password | PQID |
#7 Database Schema | public |
| We recommend changing "default passwords" in any case and using appropriate secure passwords according to your company policies! Instructions for changing passwords can be found in the WinPQ user manual. |
| Note |
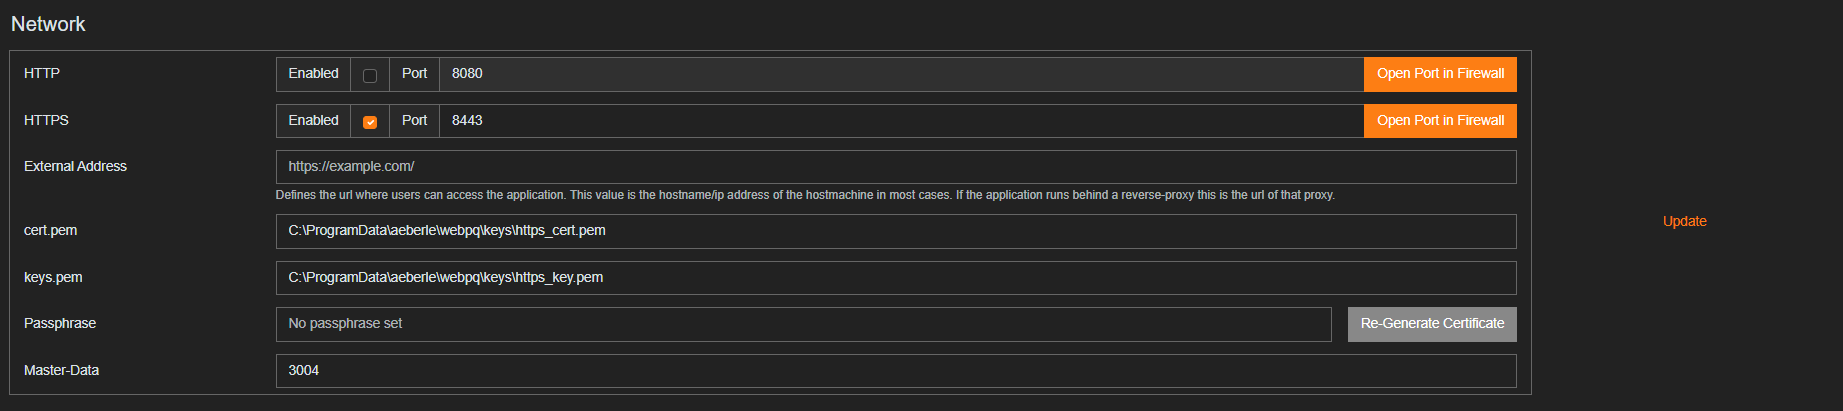
The settings in this section refer to the web server installed on the host (server) in the form of the WebPQ application and the clients (evaluation PCs) that provide the interface.
The default settings are "security by default." For example, the web server on the installed PC is only accessible by clients via HTTPS on port 8443 (#2) by default. The service of an unencrypted connection is disabled by default (HTTP).
To use "HTTPS," i.e., the encrypted connection from the client (evaluation PC) to the web server, without a warning of an unknown certificate in the browser on the client (evaluation PC), it is recommended to store your own certificates protected with a password (#6) in the WebPQ application (#3 & #4).
To store the certificates, they must be in PEM format. More information can be found under PEM Certificates.
The certificates can be stored at the specified path and selected in the program interface by clicking (#5) on the path.
| Using "unencrypted" connections and unknown certificates can lead to "data theft" and "data loss"! We always recommend using the "secure" default configuration (HTTPS)! |
| Note |
In this section of the software, all paths where the software stores data are listed. This includes exports of reports in PDF format, data exports in various formats such as CSV and COMTRADE, as well as NEQUAL, log files like the audit log, and temporary files.
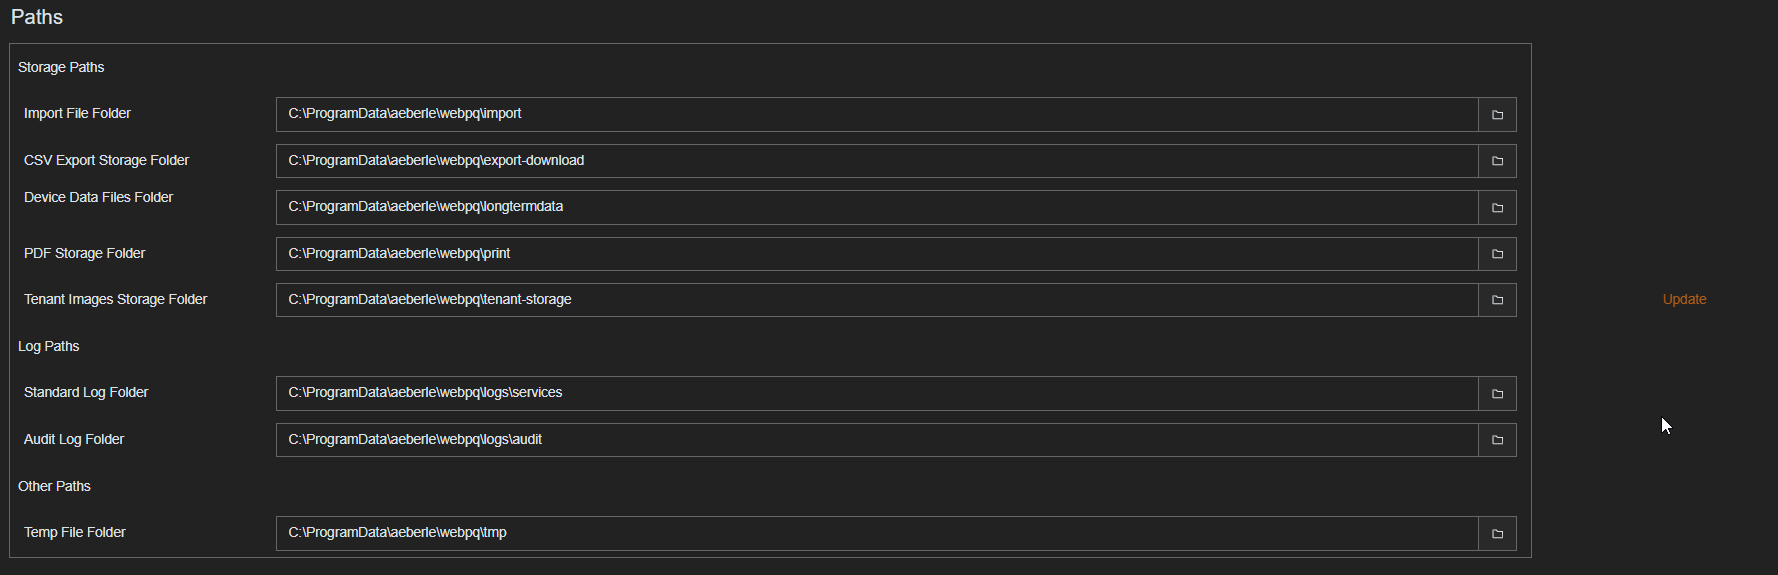
This section of the software specifies the path where the settings made in points #1, #2, #3, #4, and #5 are stored (settings.json). For example, if you want to set up a new server or plan a migration, this file can be used to transfer the settings from PC A to PC B. Passwords for the database connection and certificates are excluded from this.

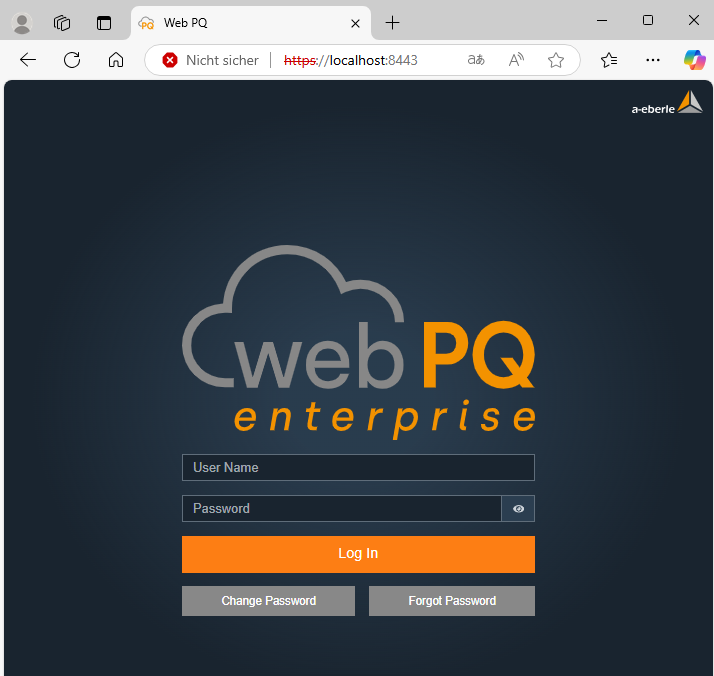
The WebPQ software is opened on workstations via a web browser by accessing a specific link. This link may vary depending on the IT environment and installation. To ensure smooth use of the software, it must be ensured that the port defined in the installation is accessible from the workstation PC and a connection to the server with the installed WebPQ software can be established.
Examples:
Local Installation
If the server on which WebPQ is installed is also the workstation PC, the software can be opened in the browser using the following link.
Client-Server Architecture
If the WebPQ software is installed on a different PC (server) than the workstation PC (client), the address of the server (in this example, the server has the IP address 10.10.1.20) must be entered.
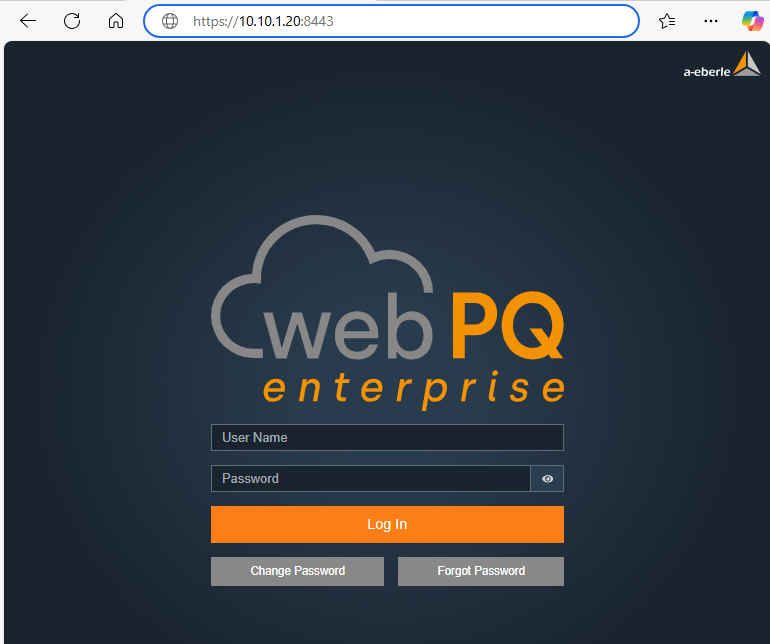
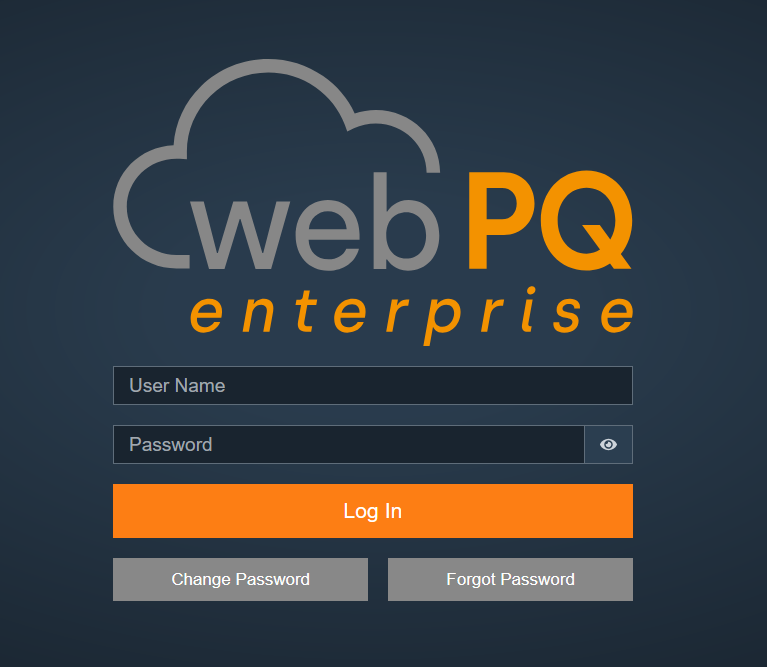
System Login:
Enter the username and password to log in directly to the system!
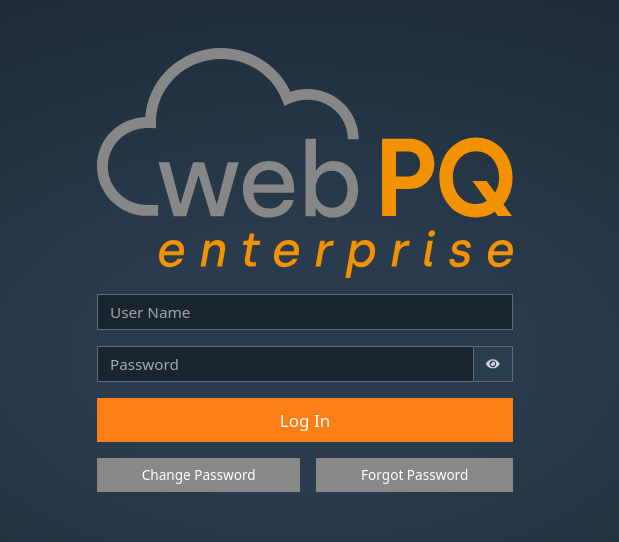
The user can set their login password directly via the Change Password function before logging in by entering their username and current password. The password policy set for the tenant must be observed!
If the system in the local installation has access to an SMTP server / mail server, it is possible to recover the password using the Forgot Password function and the email address assigned to the user.
| In case of incorrect login attempts, the user will be blocked for five minutes after five incorrect attempts. The incorrect login attempts are also logged in the system. |
| Note |
General Layout of the WebPQ Software
Overview of the user interface and its structure for easy navigation in the software.
The software is divided into the following areas for PQ and other analyses:
Visualization Pages
Description of the pre-configured dashboards that enable quick and targeted display of PQ measurements.
Usage in Analysis
Guide to efficient use of analysis functions, including available tools and settings.
Analysis Cockpit
The central analysis tool for creating individual dashboards. More than 20 different analysis types are available to perform customized evaluations.
Device Analysis
Detailed & pre-configured analysis functions for individual measuring devices to specifically access their data. A quick and easy way to keep track of individual measuring points.
Dashboard Analysis
Individual dashboards can be created via the Analysis Cockpit, which can be directly or automatically converted into scheduled reports. It is possible to create any number of dashboards and flexibly adapt them to different analysis requirements.
The "Reporting" area includes all settings required for creating normative reports (PQ standard templates). It also offers the possibility to define automated tasks (automation tasks) to execute reports and data exports on a scheduled basis.
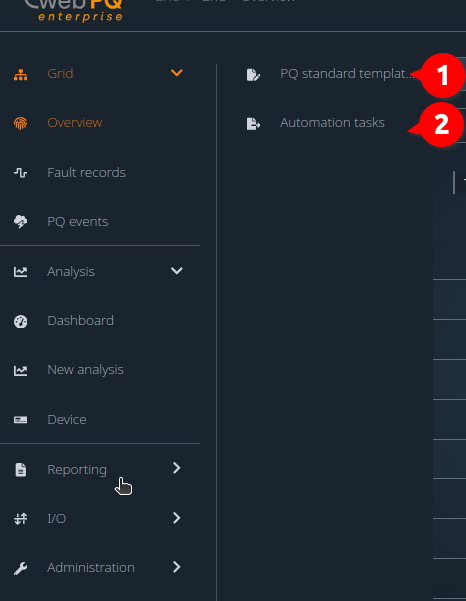
PQ Standard Templates #1
Here, all templates for calculating statistical values can be managed. This includes standardized templates such as EN50160, IEC61000-2-4, and IEC61000-2-2, which are regularly updated by A. Eberle. Based on these standard templates, the user can create their own templates and apply them to specific measuring points.
Reporting Automation #2
Allows the configuration of automated reports, email dispatch of reports and disturbance records, as well as the automatic data export and import management. The function links predefined tasks with measuring points and templates to ensure efficient report generation.
The Import/Export area includes all interfaces for data and report exchange between the WebPQ platform and external systems. Here, measurement data can be imported, reports and raw data can be exported, and synchronization processes can be monitored. Additionally, functions for manual download of PDF reports as well as CSV and measurement data import are available.
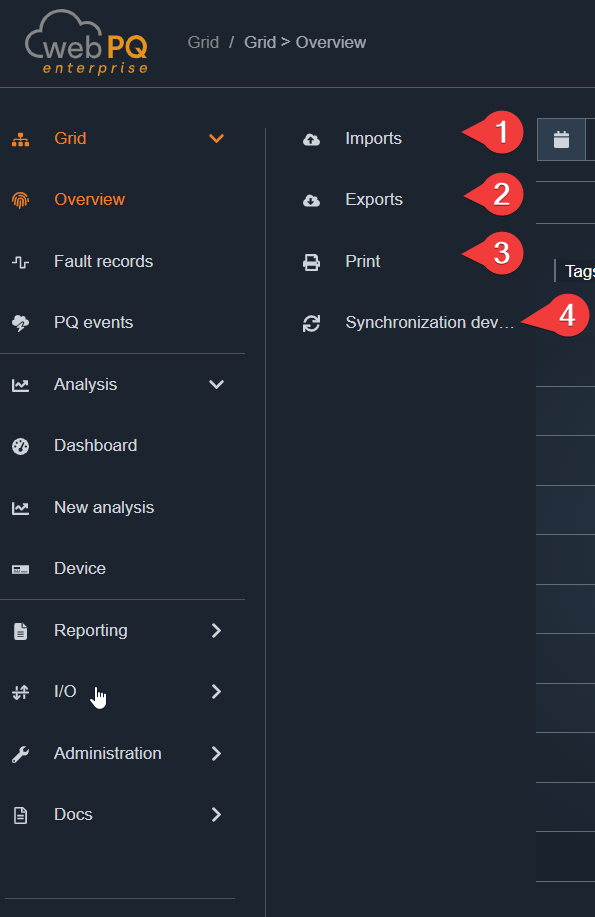
Data Synchronization (OT / IT Bridge)#3
Synchronization of measurement data between OT and IT systems from one WebPQ instance to another by means of files.
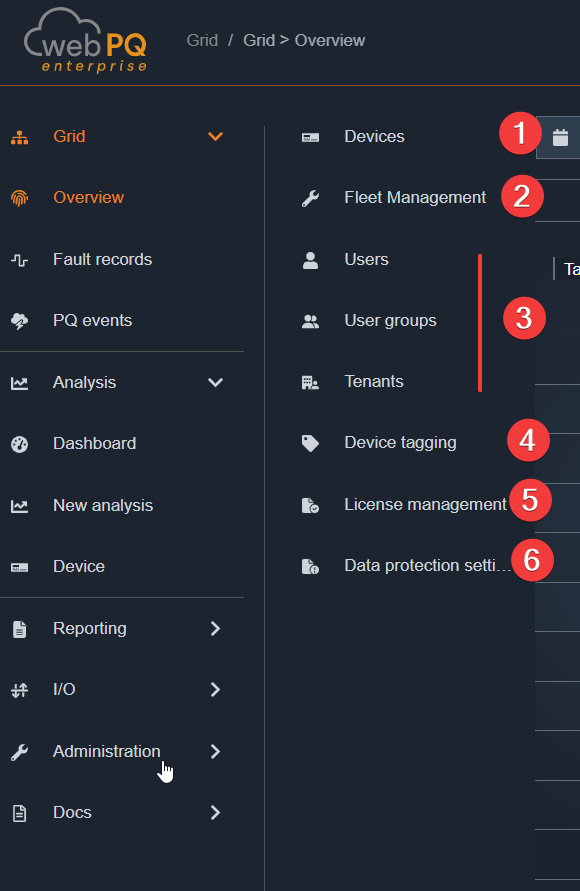
The Settings area includes all administrative functions of the software. This includes the configuration of measuring points, user and rights management, and tenant management. Additionally, other central settings are available here, such as device tagging, license management, and – if licensed – fleet management.
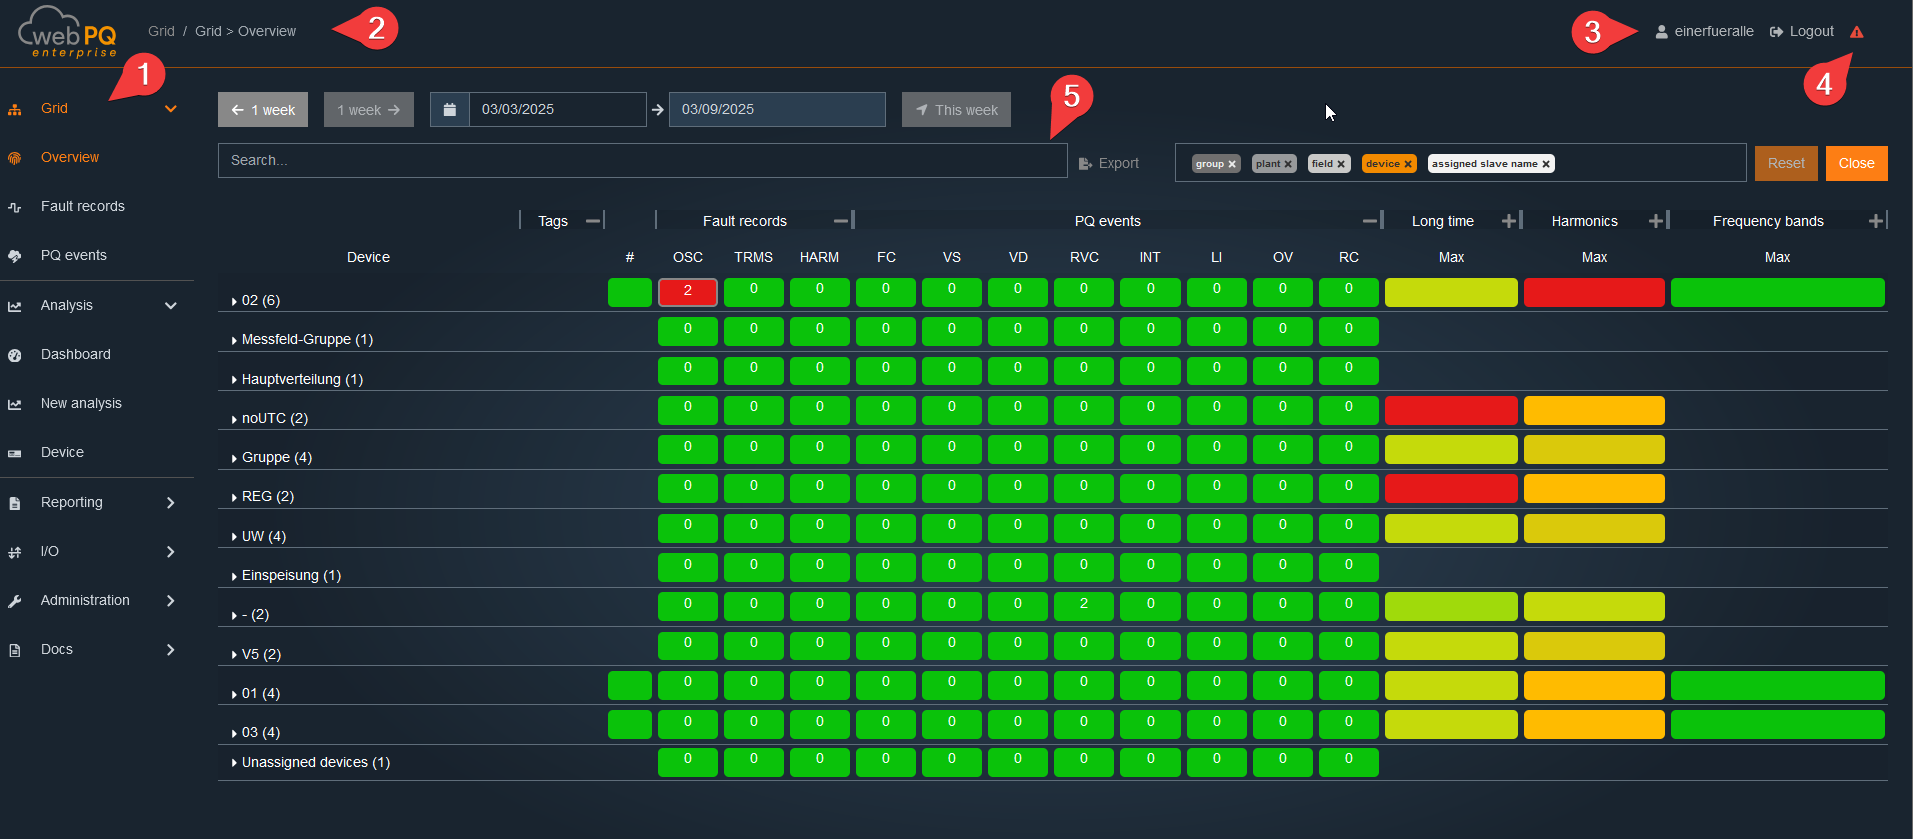
The WebPQ application is divided into three main areas:
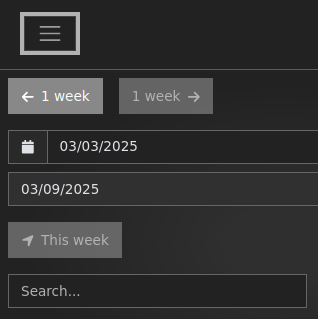
Navigation Bar: The navigation bar #1 is located on the left side. For smaller screen resolutions, it is moved to the top area. In this case, the navigation can be opened by clicking on the three lines.
Header – The header contains important controls and information:
Navigation Bar (#2): Shows the current position within the application and allows quick navigation.
Account Settings (#3): Here you can manage personal settings and view user information. See:
System Status / Syslog (#4): Provides information about the current state of the application, such as connection status or system messages. See: System Messages / System Status or Logfiles
Workspace: The central area #5 of the application, where the actual content and functions are displayed and edited. This is where data entry, analysis, and visualization take place.
To use the workspace as efficiently as possible, you can reduce the navigation bar to compact buttons. To do this, the Always Expand option #1 must be deactivated. This way, the navigation is only displayed when needed, providing more space for the actual workspace.

To organize the system with connections to many measuring points and to operate the system in a stable fashion, the software lists all messages centrally and clearly via #1.
If the exclamation mark turns red  , new system messages – such as connection interruptions or messages about the battery status of the measuring devices – have occurred. If the exclamation mark is green
  , all messages have been acknowledged (#3) or no new critical messages have occurred.
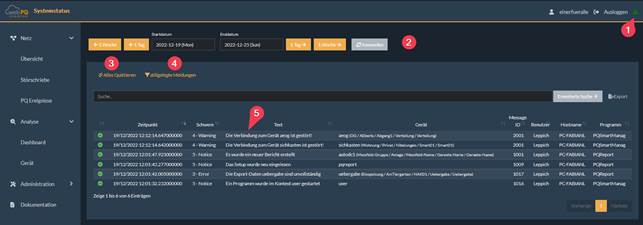
All messages can be acknowledged as a whole (#3) or individually by clicking on the message as shown in the screenshot below (#1) for each device / globally and per user or globally. To do this, select the option under device or user in the dropdown list and confirm this via #3.
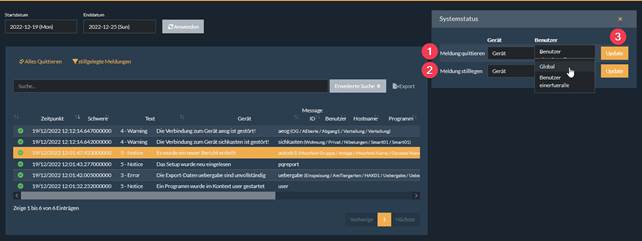
It is also possible to "silence" individual messages. This may be necessary, for example, when shutting down a connection for maintenance purposes. To do this, select function #2 "Silence Message". This function can also be set per device or globally for the message type per user or for all users. The "silenced messages" button  allows you to view and reactivate the silenced messages. To do this, simply click on
  in the respective row of the message to be reactivated.
Each user can customize individual settings such as language, theme, and password directly in their user profile.
To open the settings, click on your username at the top right:

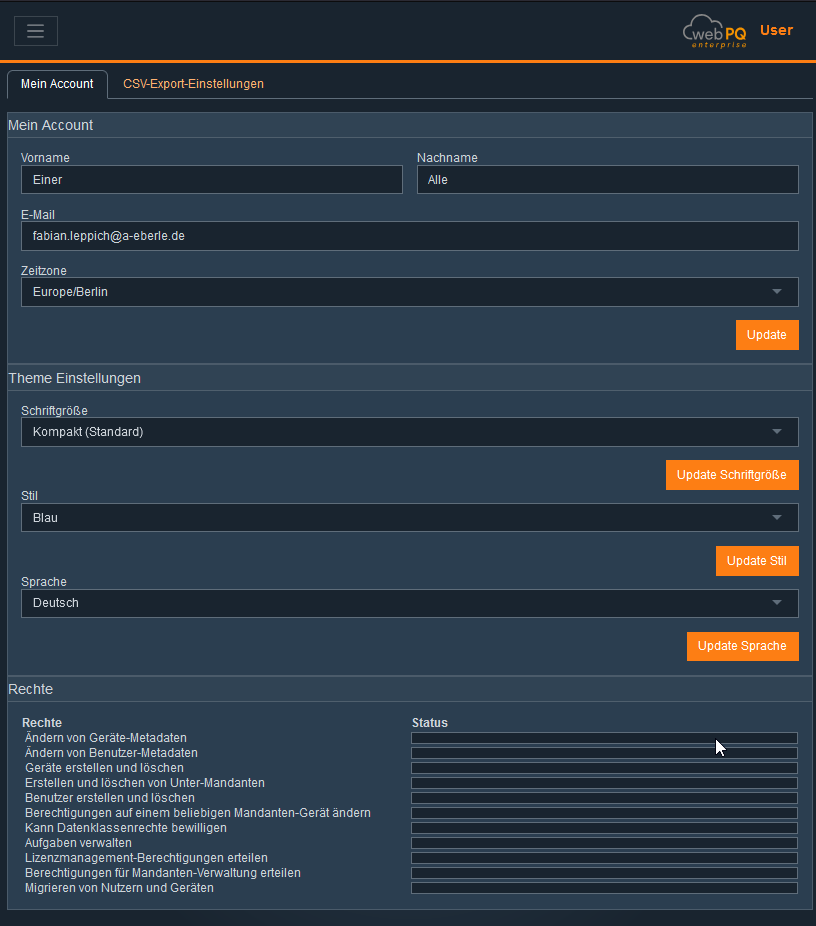
In the Account Settings section, personal data such as name and email address are displayed and can be edited.
The timezone can also be configured here, which is important for the correct display of timestamps throughout the software.
Changes are applied immediately after clicking Save and apply to all logged-in devices.
Technical Notes:
Changes to email or password require re-authentication (JWT token is updated).
The timezone setting affects all time information in reports and notifications.
In the Theme Settings section, the appearance of the software can be customized:
Font size: Choose between three predefined sizes (Standard, Large, Extra Large)
Color scheme: Switch between Blue, Black, or Light theme
Language: Select the software language (e.g., German, English)
Technical Notes:
Theme and language settings are stored locally in the browser and server-side in the user profile.
Changes to color scheme and font size take effect immediately in the UI (without reloading).
The language setting controls all UI texts and system notifications.
The permissions assigned to the user are displayed here clearly and in read-only mode.
Typical permissions include Admin, Read, Write, Device Management, etc.
Managing and assigning user permissions is only possible in the separate administration area of the software.
The homepage of the Grid > Overview software provides the user with a quick overview "Heatmap" of all devices connected to the WebPQ software. This overview spans a selected time period, #1, typically a calendar week. The landing page is automatically updated every 60s to always display the latest disturbances. Using the #2 function, the interface can be sorted into custom hierarchy levels, allowing many measurement points to be displayed hierarchically according to the application. More information can be found under Hierarchy Settings
The devices are sorted by default according to the number of disturbances in the #3 area. Disturbances are color-coded:
Red: Unacknowledged disturbances
Green: Acknowledged disturbances
Clicking on an OSC or TRMS record opens the Analysis Cockpit. Subsequently, the button color with the number of records changes from red to green.
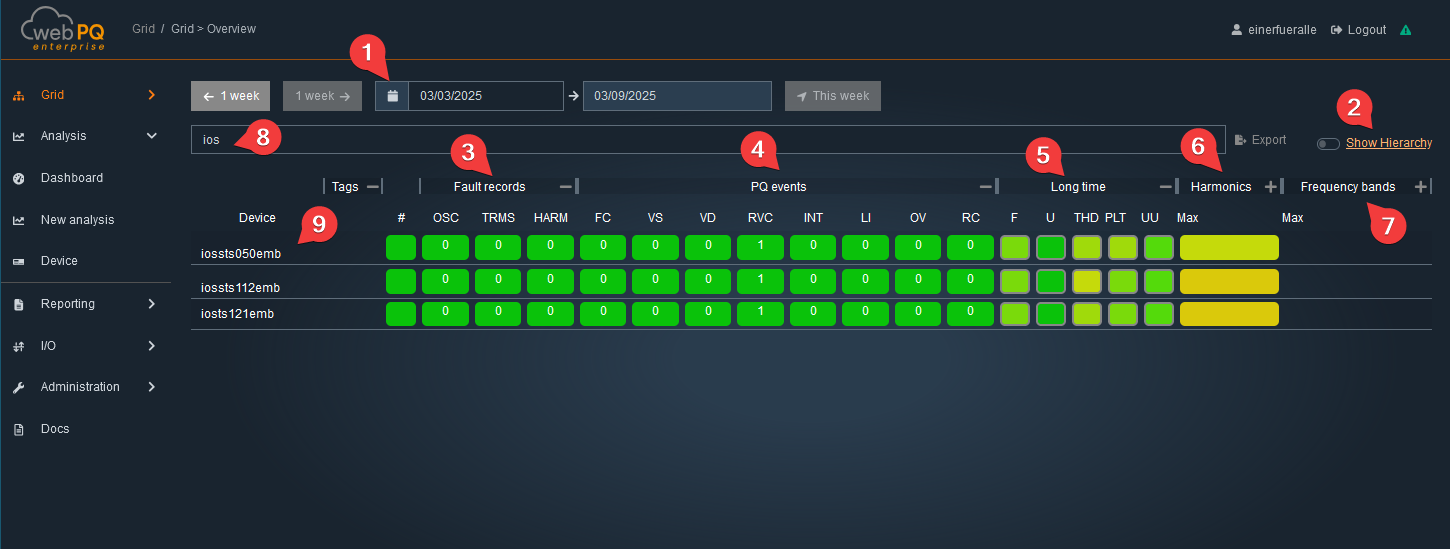
In the PQ – Events#4 area, the number of power quality events is listed based on the power quality standard stored and set in the measuring device – e.g., EN50160 or IEC61000-2-4.
Clicking on the -/+ allows the individual areas to be expanded or collapsed. In the collapsed state, the maximum values of the subordinate measurements are always used for the display.
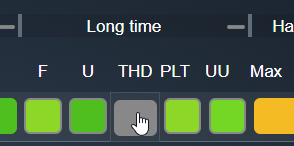
In the Long-term Data#5 area, the statistical data is calculated according to the standard stored in the measuring device. These include:
Frequency[F]
Voltages[U]
THD (Total Harmonic Distortion)
Flicker[PLT]
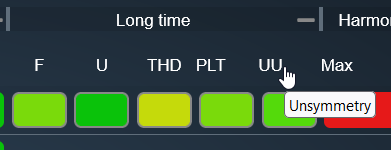
Voltage Unbalance[UU]
When the mouse pointer hovers over an abbreviation, an explanation is displayed via a tooltip.
Clicking on the designation, e.g., PLT, sorts the display either from the worst to the best measurement point or vice versa. This function facilitates the identification of the most noticeable measurement points for the respective measurement value.
Clicking on the respective measurement values – e.g., THD – opens the Analysis Cockpit. This allows the abstract representation of the measurement values to be converted into a temporal representation for detailed analyses.
In the Harmonics#6 area, all harmonics from H2 (100 Hz) to the 50th harmonic (2500 Hz) as well as the Supraharmonics#7 are listed in relation to the respective limit value. The color scale in the statistical measurements shows the proximity to the limit value:
Green: Values well below the limit
Yellow/Orange: Values approaching the limit
Red: Values exceeding the limit
To quickly find a desired measurement point, the name of a measuring device can be entered in the Search Bar#8 area. The display is then interactively filtered.
Clicking on a device name#9 switches the application from Grid >> Overview to the Analysis >> Device page.
In the second area Grid Overview – Tile View, all devices with their essential live values are displayed within the configured hierarchy levels.
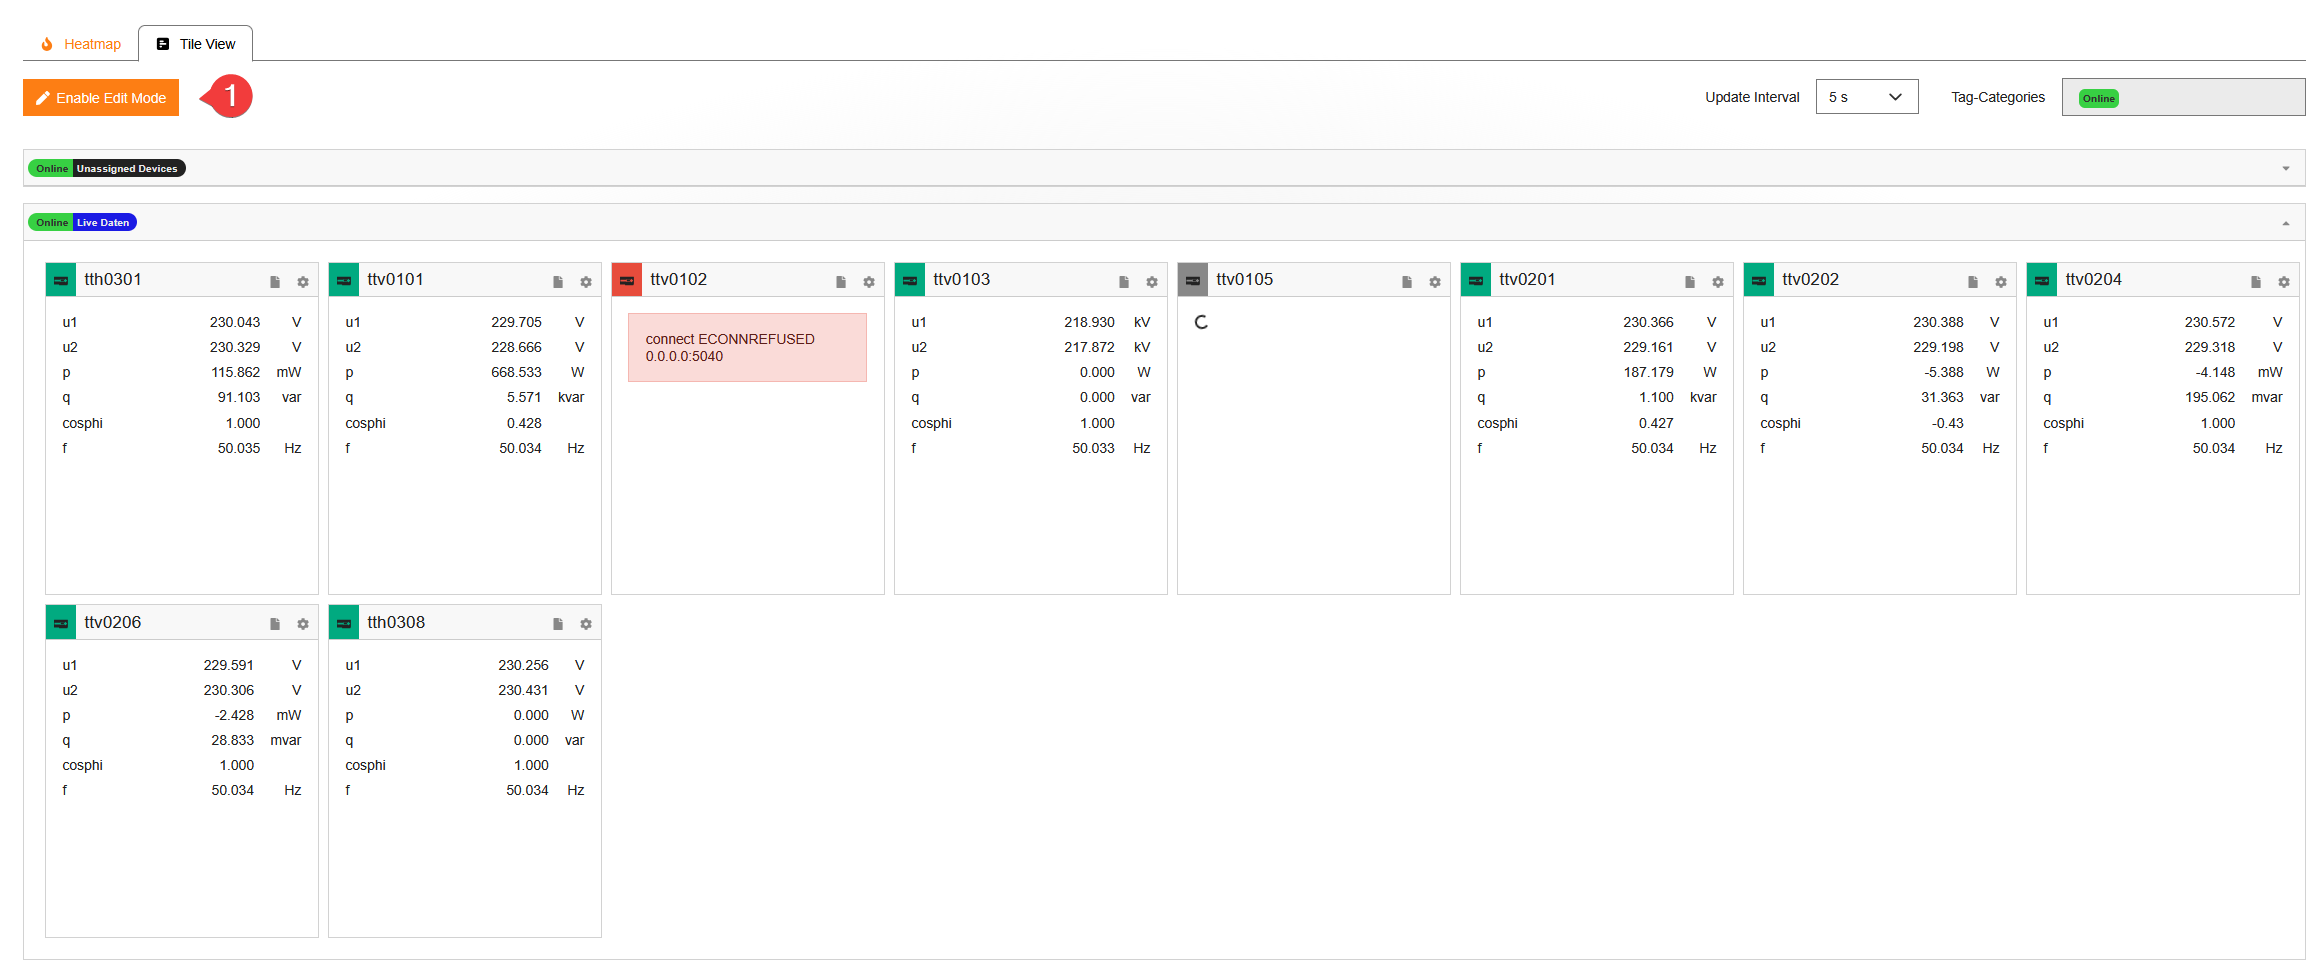
With Enable Edit Mode #1 the tile arrangement can be changed via drag & drop and devices or groups can be assigned to other hierarchy levels. After Save the adjustments are stored persistently and loaded on next access. Changes apply system-wide for all users and can be centrally managed by the administrator.
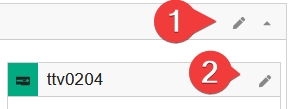
Via Change Default Displayed Measurements you can define which live data appear in the tiles. All real-time values provided by the measuring device are available. Settings can be made
globally (all devices),
per group,
or per device (#3) in edit mode.
Usage:
Displayed Data for the Group: Applies to all devices in the group.
Displayed Data for the Device #3: Individual device configuration.
The refresh interval of the live data is configurable. The hierarchy order can be adjusted using drag & drop in the upper right corner.
A tile contains the following elements in live operation:
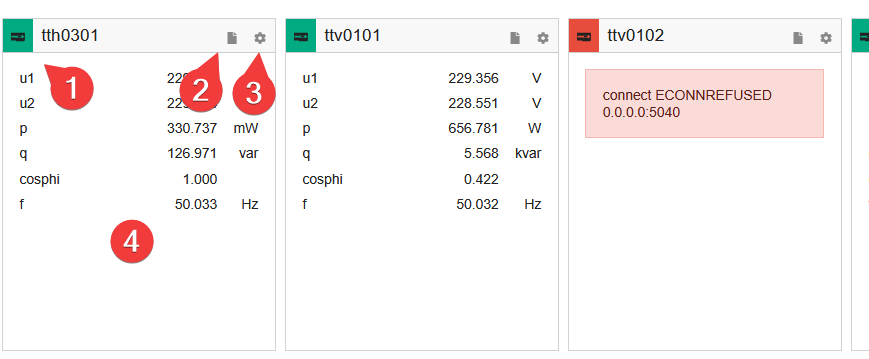
#1 Connection status: Red = no connection, Green = connection active#2 Link to the Power Quality report (e.g., EN50160, IEC61000-2-4)#3 Link to device parameterization#4 Display of the configured live data
Map View allows users to see devices on a map and combine the geographical view with threshold utilization, fault records, and PQ events for the selected time range. It is intended for quickly locating affected areas and then jumping to the relevant analysis or device settings.
Prerequisites
Maps zip package provided by Application Support
Access to the WebPQ backend running on the WebPQ server
A folder on the WebPQ server where map data will be stored. By default, C:\ProgramData\aeberle\webpq\maps is preconfigured. The next section explains how to change this path.
Configure the path in the WebPQ backend
Open the WebPQ backend.
Scroll to Paths.
Set the Maps Storage Folder field to the desired folder.
Save the change (Update) so the setting is applied.
Place the maps package in the maps folder
Extract the zip file to the configured maps folder.
Two files must now exist in the root of the maps folder: map.mbtiles, which contains the actual map data, and map-info.md. This file contains information about the region and detail level of the maps package, which helps when downloading a newer package later.
Restart the WebPQ Server service after a new package was extracted or replaced so the tiles are loaded again.
Verification
In WebPQ, navigate to Grid > Overview > Map View.
If no map package is loaded yet, a message box explains the required setup steps.
The documentation link in the upper right corner of Map View opens this documentation section.
Troubleshooting
No map loads: verify the maps folder path, folder permissions, and restart the WebPQ Server service.
Map does not render: ensure the zip file was extracted and map.mbtiles is present in the folder root.
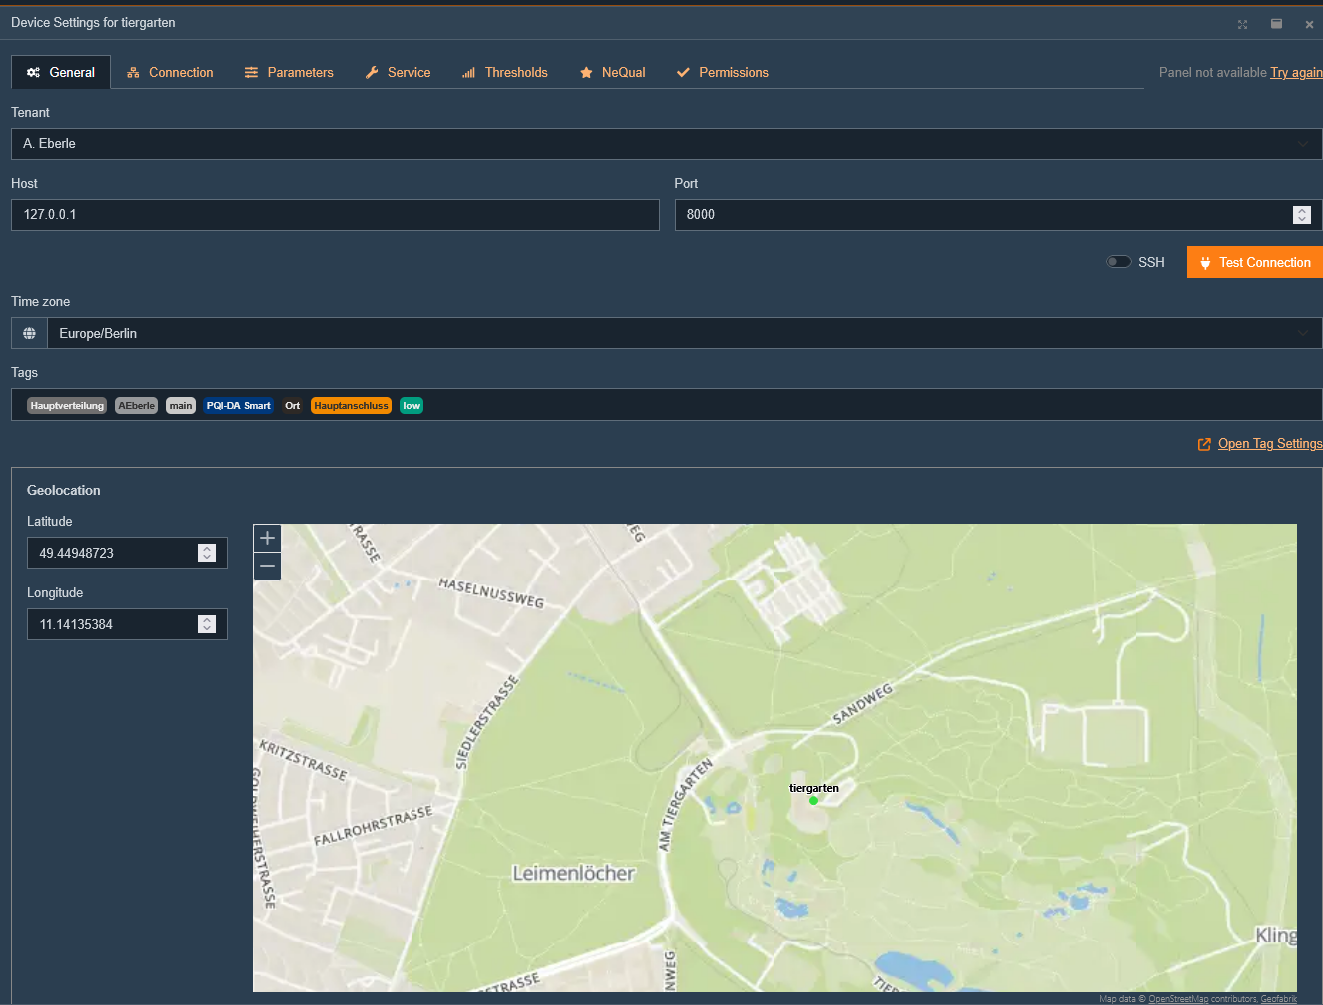
No device pins: confirm latitude/longitude are configured for the device (see Device Settings).
A device appears in tables but cannot be focused on the map: the device does not yet have valid geodata. Open Device Settings and update the location.
To display a device in Map View, the device geocoordinates must be configured first. Open Device Settings and select a device. The device position can be configured in the General tab. Enter latitude and longitude, or set the coordinates by clicking on the map.
Map View is divided into three areas:
View settings
The map with tooltip
Information panels
View settings
Contains the following UI elements:
Show All resets the map to the initial overview of all devices with geodata.
Time interval filters threshold utilization, fault records, and PQ events. The default range is the last 7 days.
Show only visible devices limits the bottom panels to the devices currently visible in the map viewport. The setting is stored and restored when Map View is opened again.
Show Hierarchy controls whether hierarchy tags are shown in tooltips and bottom-panel tables. This setting is shared with the overview-page hierarchy display.
The documentation link in the upper right corner opens the corresponding customer-documentation anchor for Map View.
Map
Initially, Map View shows all devices that have a configured geolocation. Multiple nearby devices are shown as a cluster with the number of devices. Clicking a cluster zooms in until individual devices are visible.
Marker colors can reflect the currently calculated threshold utilization, which helps identify critical areas immediately on the map.
Each device is shown with a pin and the device name. Clicking a pin opens a tooltip with information about the device:
Device name and links to the PQI app, reporting page, and device parameterization
Hierarchy tags, if Show Hierarchy is enabled
Last synchronized data point and how long ago the last data import occurred
Address configured for the device
Threshold utilization as a table overview
Selecting a device from one of the bottom-panel tables centers the map on that device and opens the tooltip. Devices without configured geodata remain visible in the tables, but they cannot be focused on the map until a location is configured.
Information Panels
At the bottom of Map View there is a panel with four columns. Above each column there is a heading with relevant links to other areas of the application.
Clicking any device name centers the map on that device and opens the tooltip. Each information panel column can be expanded or collapsed using the small arrow button in the column header. Collapsed columns appear as narrow tabs on the left side. Column width can be adjusted by dragging the separators. The overall panel height can also be resized. Column widths, collapsed states, panel height, and the Show only visible devices setting are saved and restored when Map View is opened again.
Devices:
Shows the currently relevant devices together with the configured address. Depending on the Show only visible devices toggle, this is either the current map viewport or the complete device set. The table supports sorting and filtering by device name and hierarchy tags.
Fault Records:
Shows recorded fault records for the selected time range and the currently relevant devices. The heading contains a direct link to the Fault Records page.
The table shows the time, device, type, and trigger-related information. Clicking a fault-recording type opens the detail view directly in the panel.
Thresholds and utilization:
The header contains a shortcut to the corresponding cockpit analysis for the selected time range.
Utilization of the user-defined thresholds of the devices.
Users see the maximum utilization of the thresholds defined for each device. Clicking a utilization percentage opens the Analysis Cockpit with the corresponding threshold data. Clicking a threshold value opens the related threshold settings, if a reporting setting is available.
The application is able to assign a threshold to each measured value and display the utilization here as a maximum value. More in the chapter "customer-specific thresholds". @Fabian insert link to new Threshold chapter here.
PQ Events:
Lists PQ events for the selected time range and the currently relevant devices. The heading contains links to the PQ Events over Time analysis and the PQ Events page.
The table shows the event time, device, linked OSC/TRMS recordings, event type, and the measured value. Sorting and filtering can be used to narrow down the list to specific event types or devices.
In the Grid > Fault Records area, all disturbances within a freely selectable time period #1 are displayed in a list.
The display offers the following functions:
Date-range jump buttons for quickly switching by week and jumping back to the current day
Hierarchy display for showing or hiding the configured device-tag hierarchy in the device column
Search function#2 for targeted search of disturbances
Device filtering via the device tree in the table header
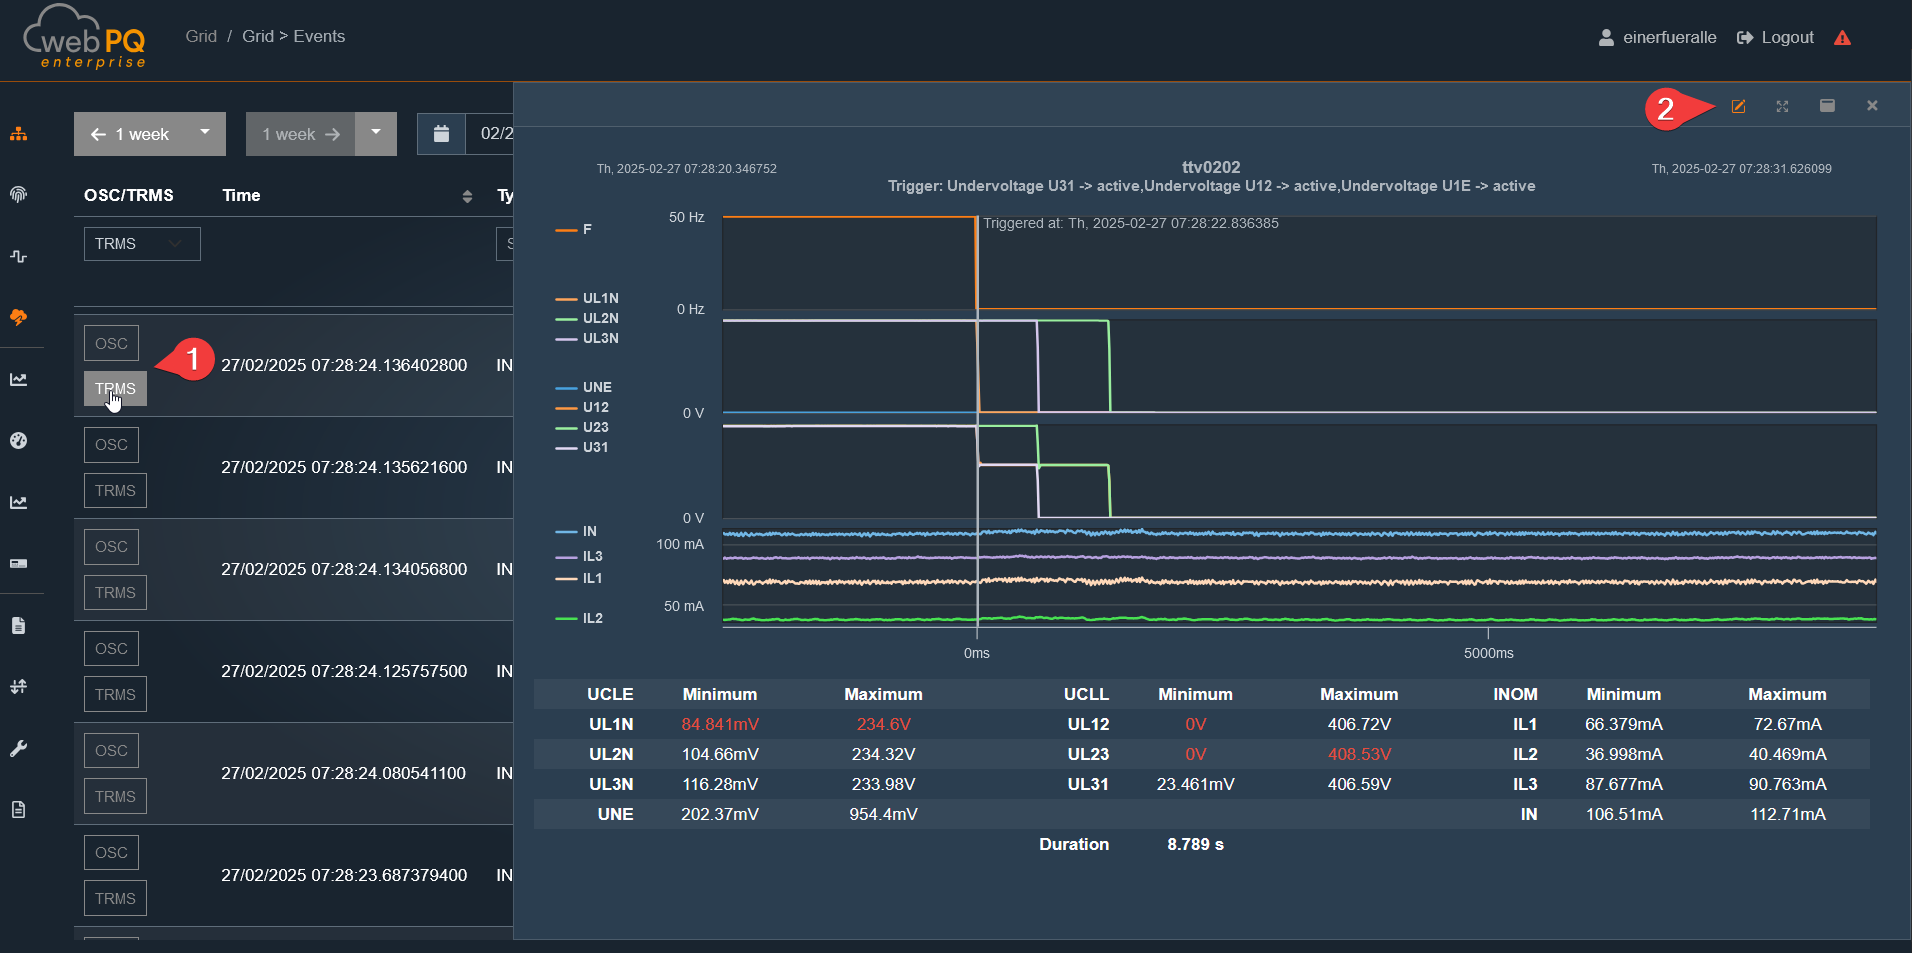
Ability to open fault records via the OSC and TRMS#3 links in a Quick View
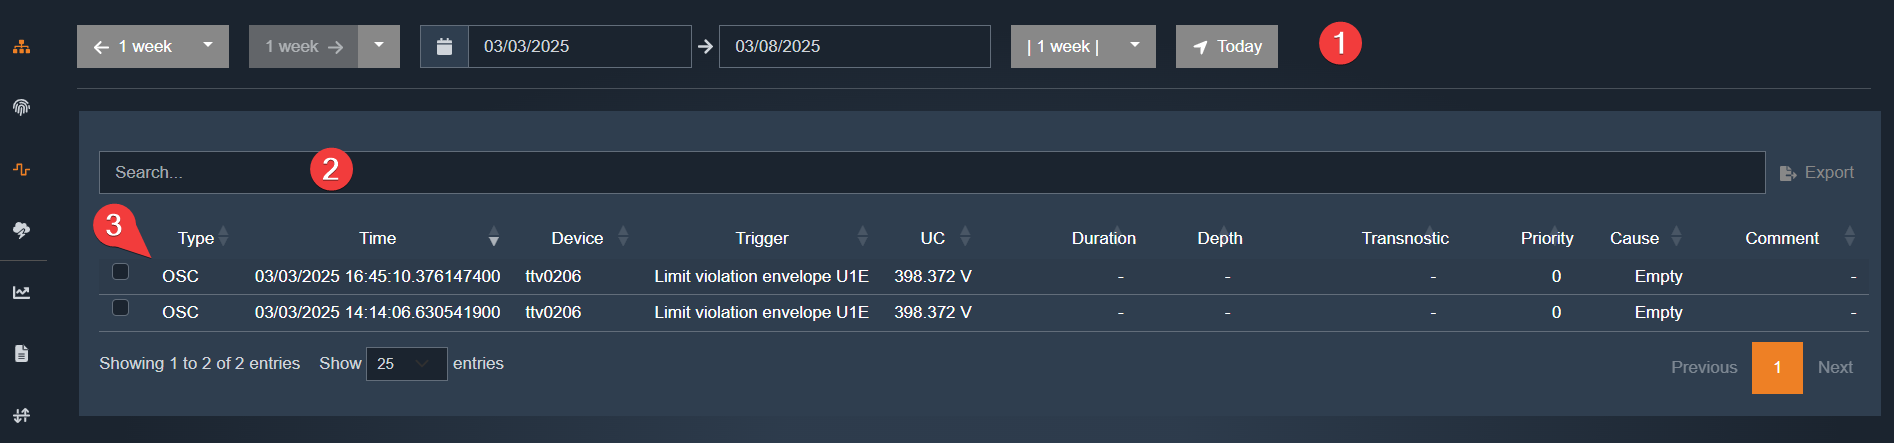
In the #4 area, the user can set individual filters. In the shown example, a filter on duration > 50 ms is set, displaying only disturbances in this range. The table can also be sorted by type, time, device, trigger, duration, and other available columns.
The device column supports both free-text search and selection through the device tree. If hierarchy display is enabled, the configured device tags are shown directly in the list so that disturbances can be grouped more easily by location or structure.
Clicking on OSC or TRMS#1 opens the Quick View window from the right.
For advanced analysis options, setting markers, or describing the disturbance, the Analysis Cockpit can be opened via #2.
Clicking a device entry opens the corresponding device page at the event time. This helps when the fault record needs to be checked together with device details or configuration.
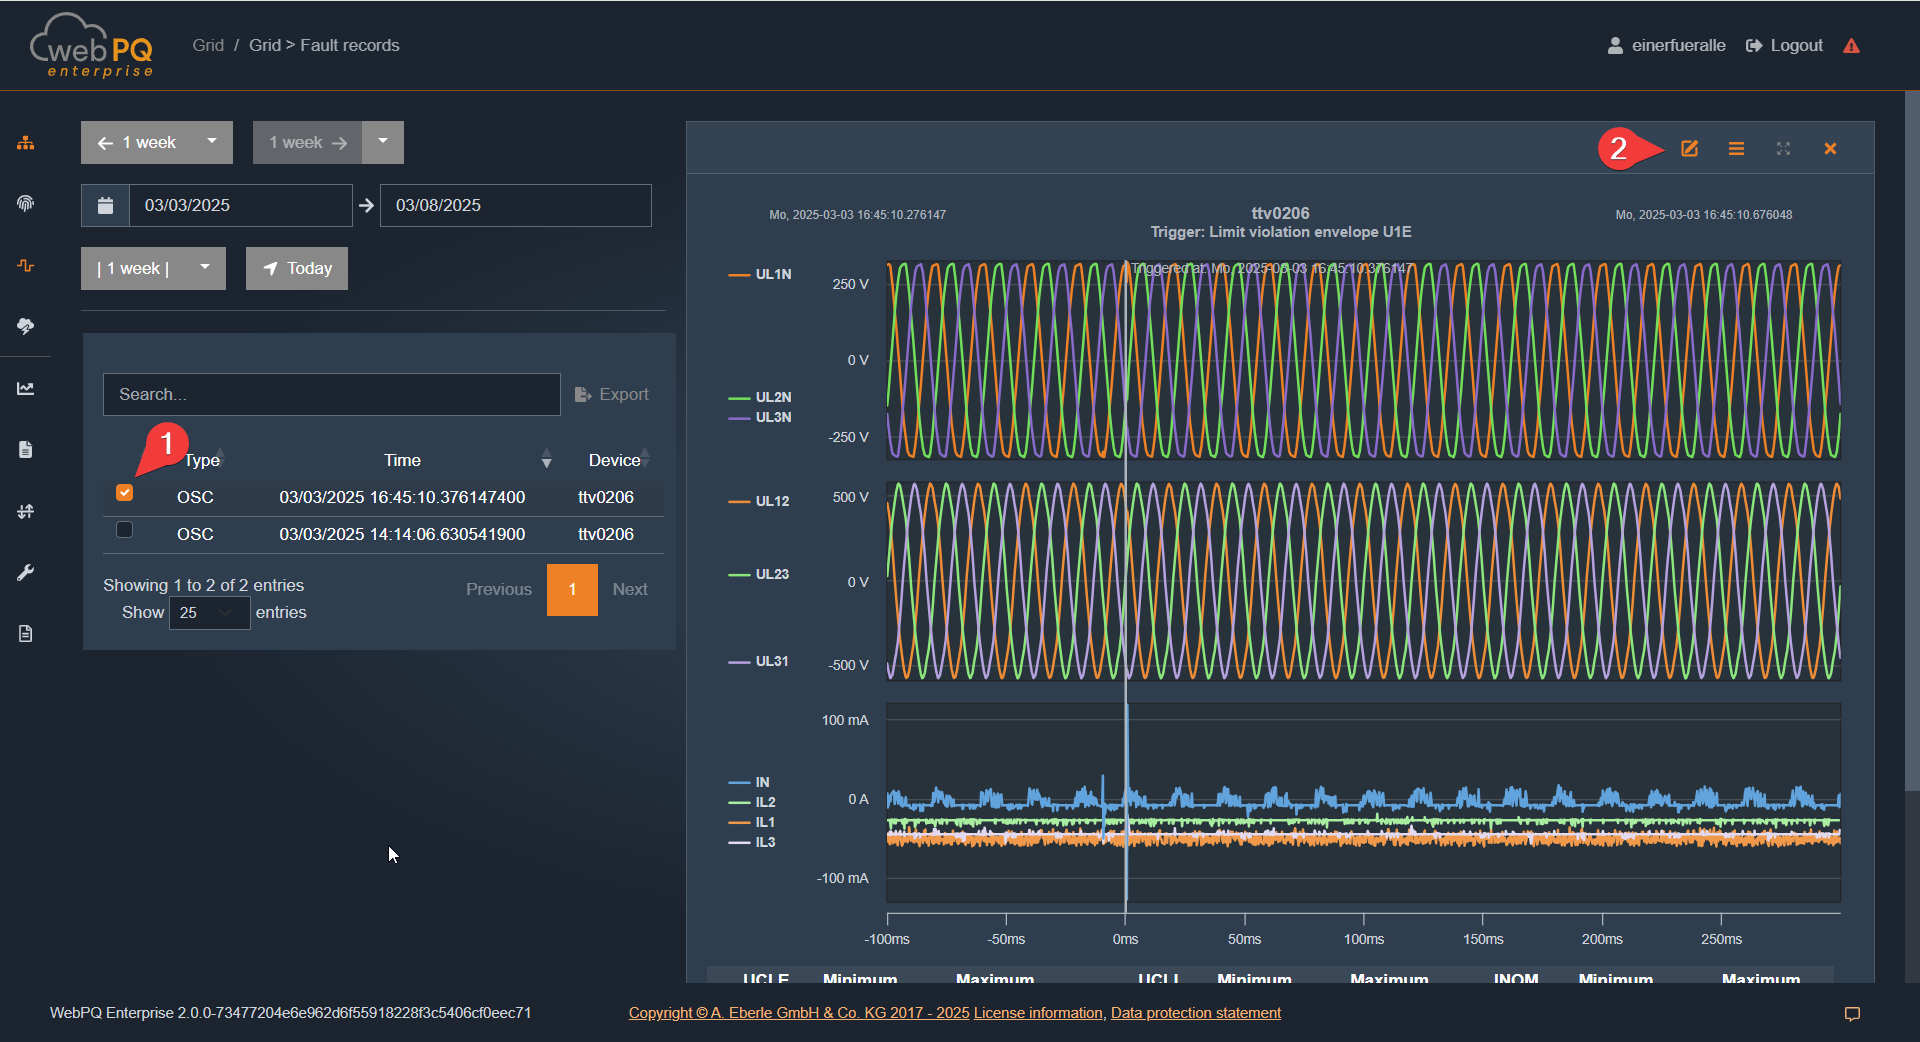
To view two or more fault records in parallel, multiple disturbances can be selected via the selection function. The selected records can then be loaded together into the analysis view for direct comparison.
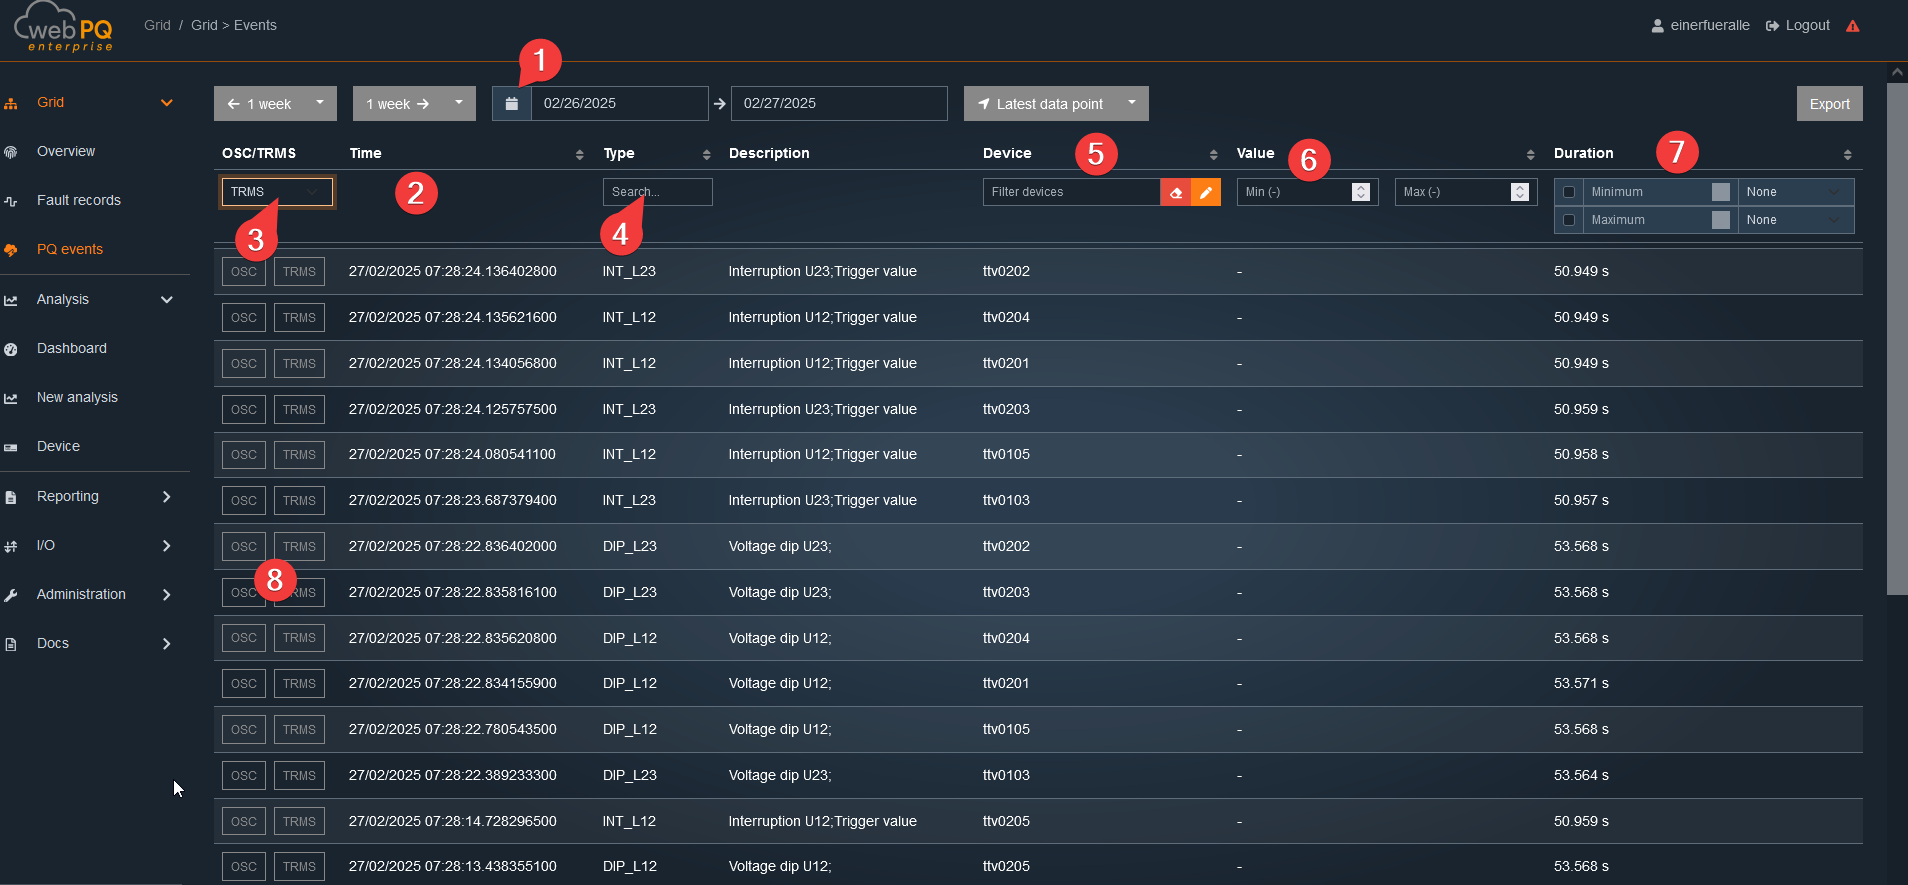
In the Grid > PQ Events area, all Power Quality Events (not disturbance records!) within a freely selectable time period #1 are displayed in a table.
The display offers several search and filter functions#2:
Filter by disturbance record (#3): Shows only PQ events where a disturbance record was triggered according to IEC
Filter by type (#4): Allows free text search for the type of event
Filter by device (#5): Convenient device narrowing via device selection
Filter by value range (#6): Setting an upper and lower limit value
Filter by duration (#7): Restriction to events of a certain duration
Above the table, the same date-range jump buttons as in the fault-record view are available. The table also provides a hierarchy toggle so that configured device tags can be shown or hidden in the device column.
The device filter only offers devices that actually have PQ events in the selected time range. This makes it easier to narrow large installations down to the relevant sources quickly.
Additionally, existing disturbance records can be opened directly in a Quick View via the OSC and TRMS#8 links.
The Description column is derived from the PQID metadata of the event type. This means the table shows the translated event description that belongs to the stored PQ event.
The current result set can be exported directly via the Export button above the table.
Clicking on OSC#1 opens the Quick View window from the right.
For advanced analysis options, setting markers, or describing the disturbance, the Analysis Cockpit can be opened via #2.
To zoom, use the left mouse button or, on a touch display, the standard two-finger zoom gesture.
Zoom In: Hold down the left mouse button and drag left or right.
You can save the zoomed area using the "Keep Zoom" function #1.
To reset the zoom to its original value, use "Reset Zoom".
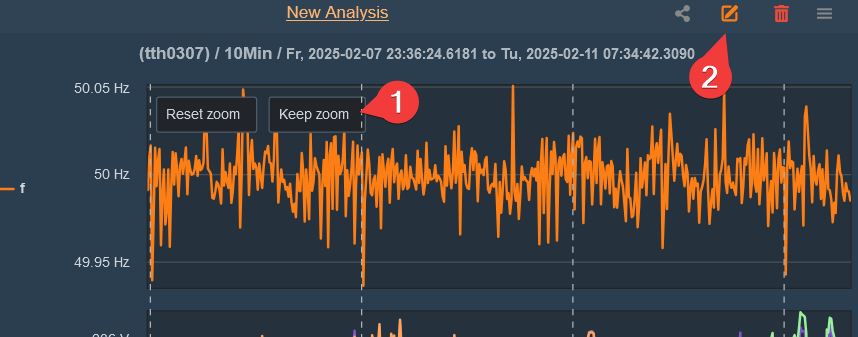
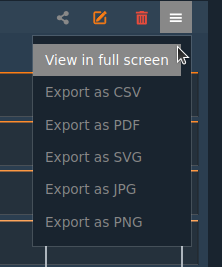
#2View in Full Screen Mode: Expands the graphic to fill the entire monitor, which is especially useful for tablets or phones.
Export as CSV: Saves the measurement data as a CSV file.
Export as PDF: The disturbance record is saved as a PDF and can be downloaded from the server via (Import/Export >> Print) after creation.
Export as JPG / SVG or PNG: Exports the graphic in various image formats.
Export as Comtrade: Converts the disturbance record into a Comtrade file, which is also available on the server via (Import/Export >> Export).
Export as PQDIF: The disturbance record or measurement data (depending on the analysis) is saved as a PQDIF file and can also be provided on the server via (Import/Export >> Export).
Note:
Exports, including PDFs, are stored on the server. The storage location is defined in the server settings in the WebPQ backend and can only be changed by the administrator. Installation Paths
By clicking on a measurement#1, individual measurements can be selected or deselected.
Deselected measurements are automatically moved to the bottom.
Measurements are always displayed in order of their height on the Y-axis.
The Analysis Cockpit can be accessed and opened at any time via the button  .
.
More information about the Analysis Cockpit can be found under Link
The Analysis Cockpit is the central workspace and analysis area, offering various types of analysis, including:
Level-time diagrams
Bar charts
Histograms
Pre-configured reports for creating custom dashboards and reports
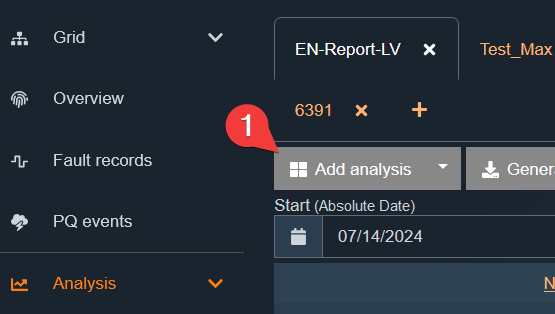
You can open the cockpit in several ways:
Via the main menu under "Perform Analysis"
Via the analysis dashboard by selecting "Add Analysis"#1
By clicking a measurement value in the statistics under "Network > Overview"
Via the shortcut from any analysis
The Analysis Cockpit is divided into two sections:
Left section: Configure settings here
Right section: Visualise measurement data here
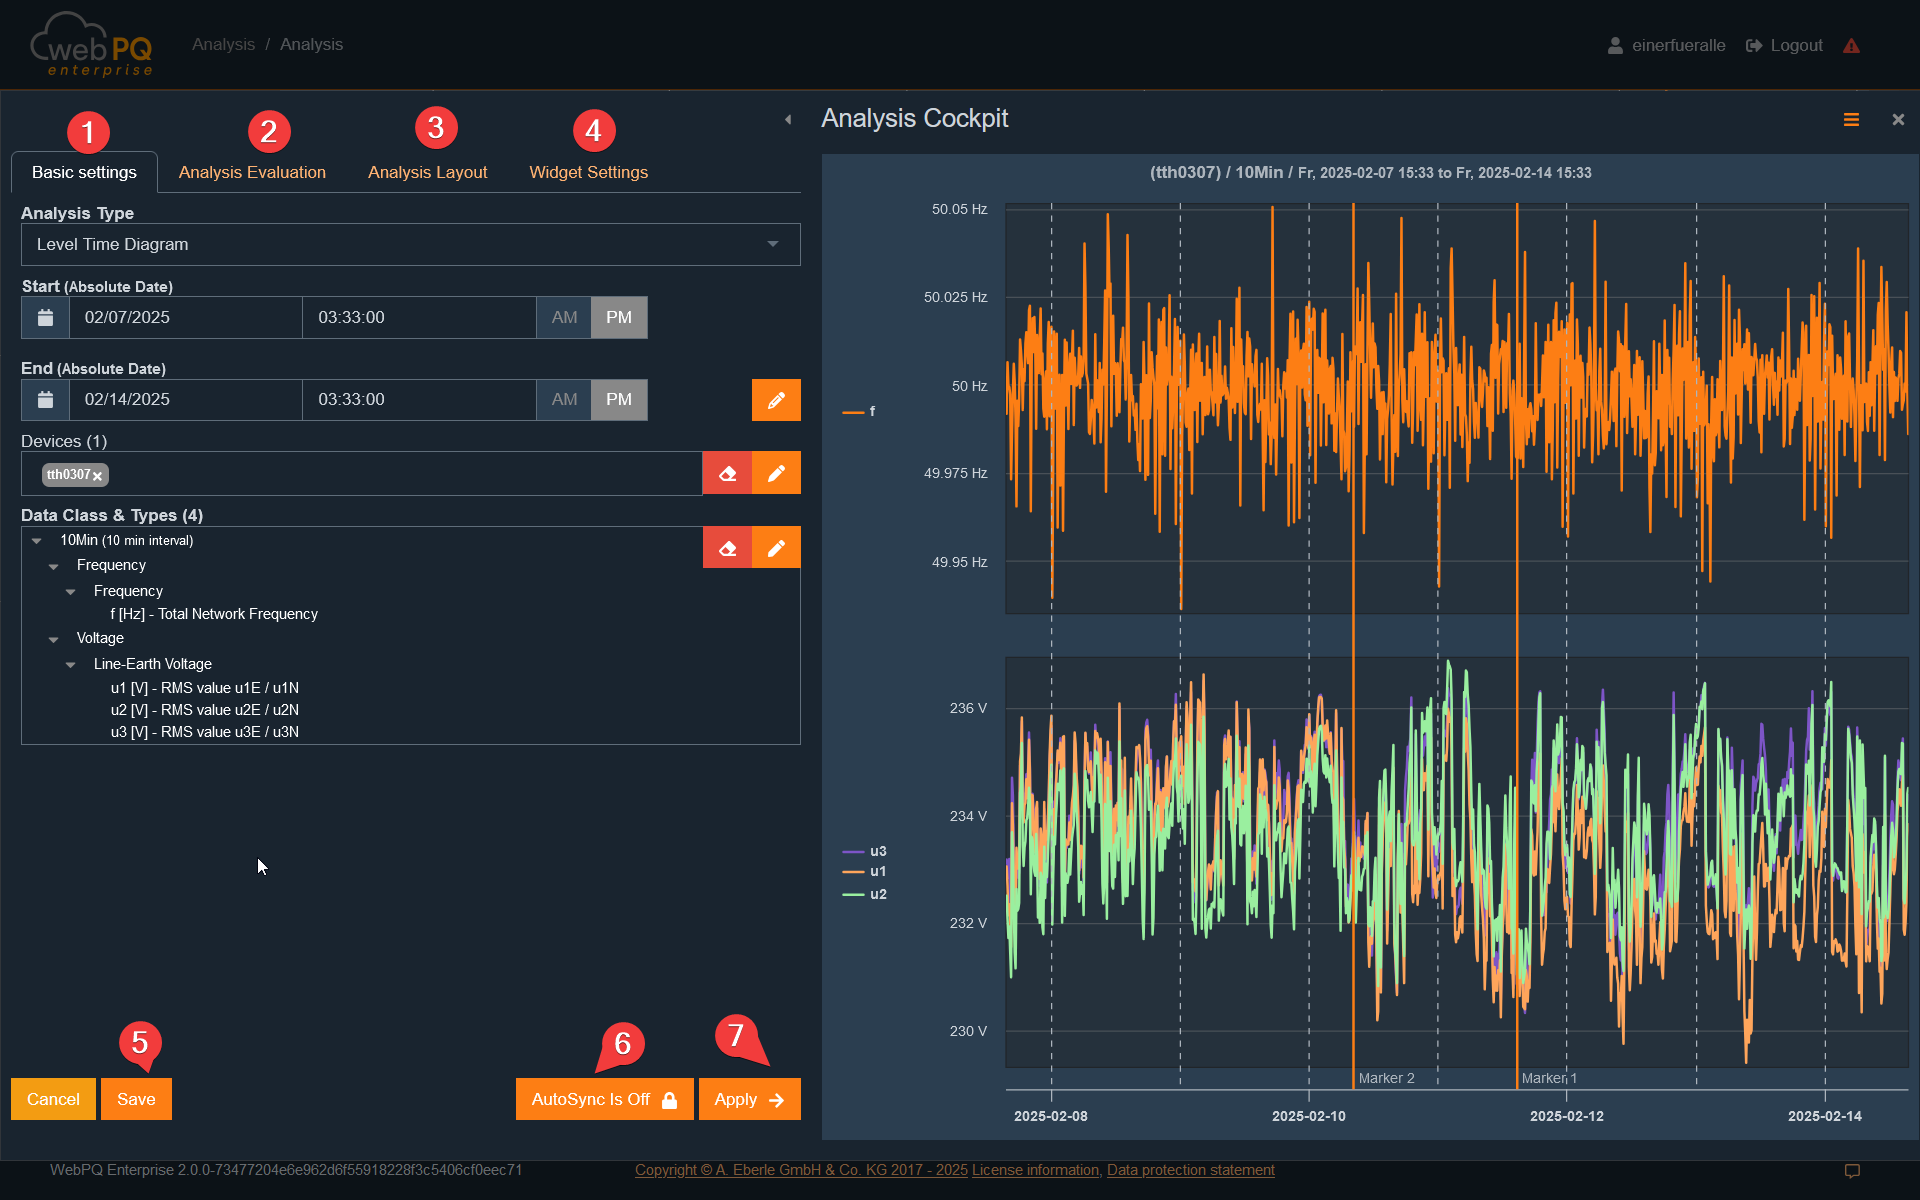
Key functions in the Analysis Cockpit:
Basic settings#1:
Select the analysis type
Define the device selection
Set the evaluation periodSettings
Choose the measurement variables
Analysis evaluation#2:
Set and display markers
Comment and prioritise disturbances
Display limit and extreme values
Analysis layout#3:
Group measurement variables
Scale the display
Select colours for measurement values
Widget settings#4:
Adjust the size and title of an analysis widget
Save the widget to the analysis dashboard
Save#5:
Permanently save the analysis in the analysis dashboard.
The dashboard is stored for the user in the database, allowing all created analyses to be recalled and restored.
Auto synchronisation#6:
When enabled, changes are immediately shown in the right section
Apply#7:
Applies the selected measurement variables and displays them in the right frame
Cancel#8:
Closes the Analysis Cockpit without saving data
Note:
The Analysis Cockpit settings are saved in the browser cache. This means data is retained even if the analysis is not saved in the dashboard.
Under #1, select the desired analysis type. By default, the level-time diagram is pre-selected. Alternatively, other types such as histograms or, for power quality event analysis, the ITIC graph can be chosen as the evaluation type.
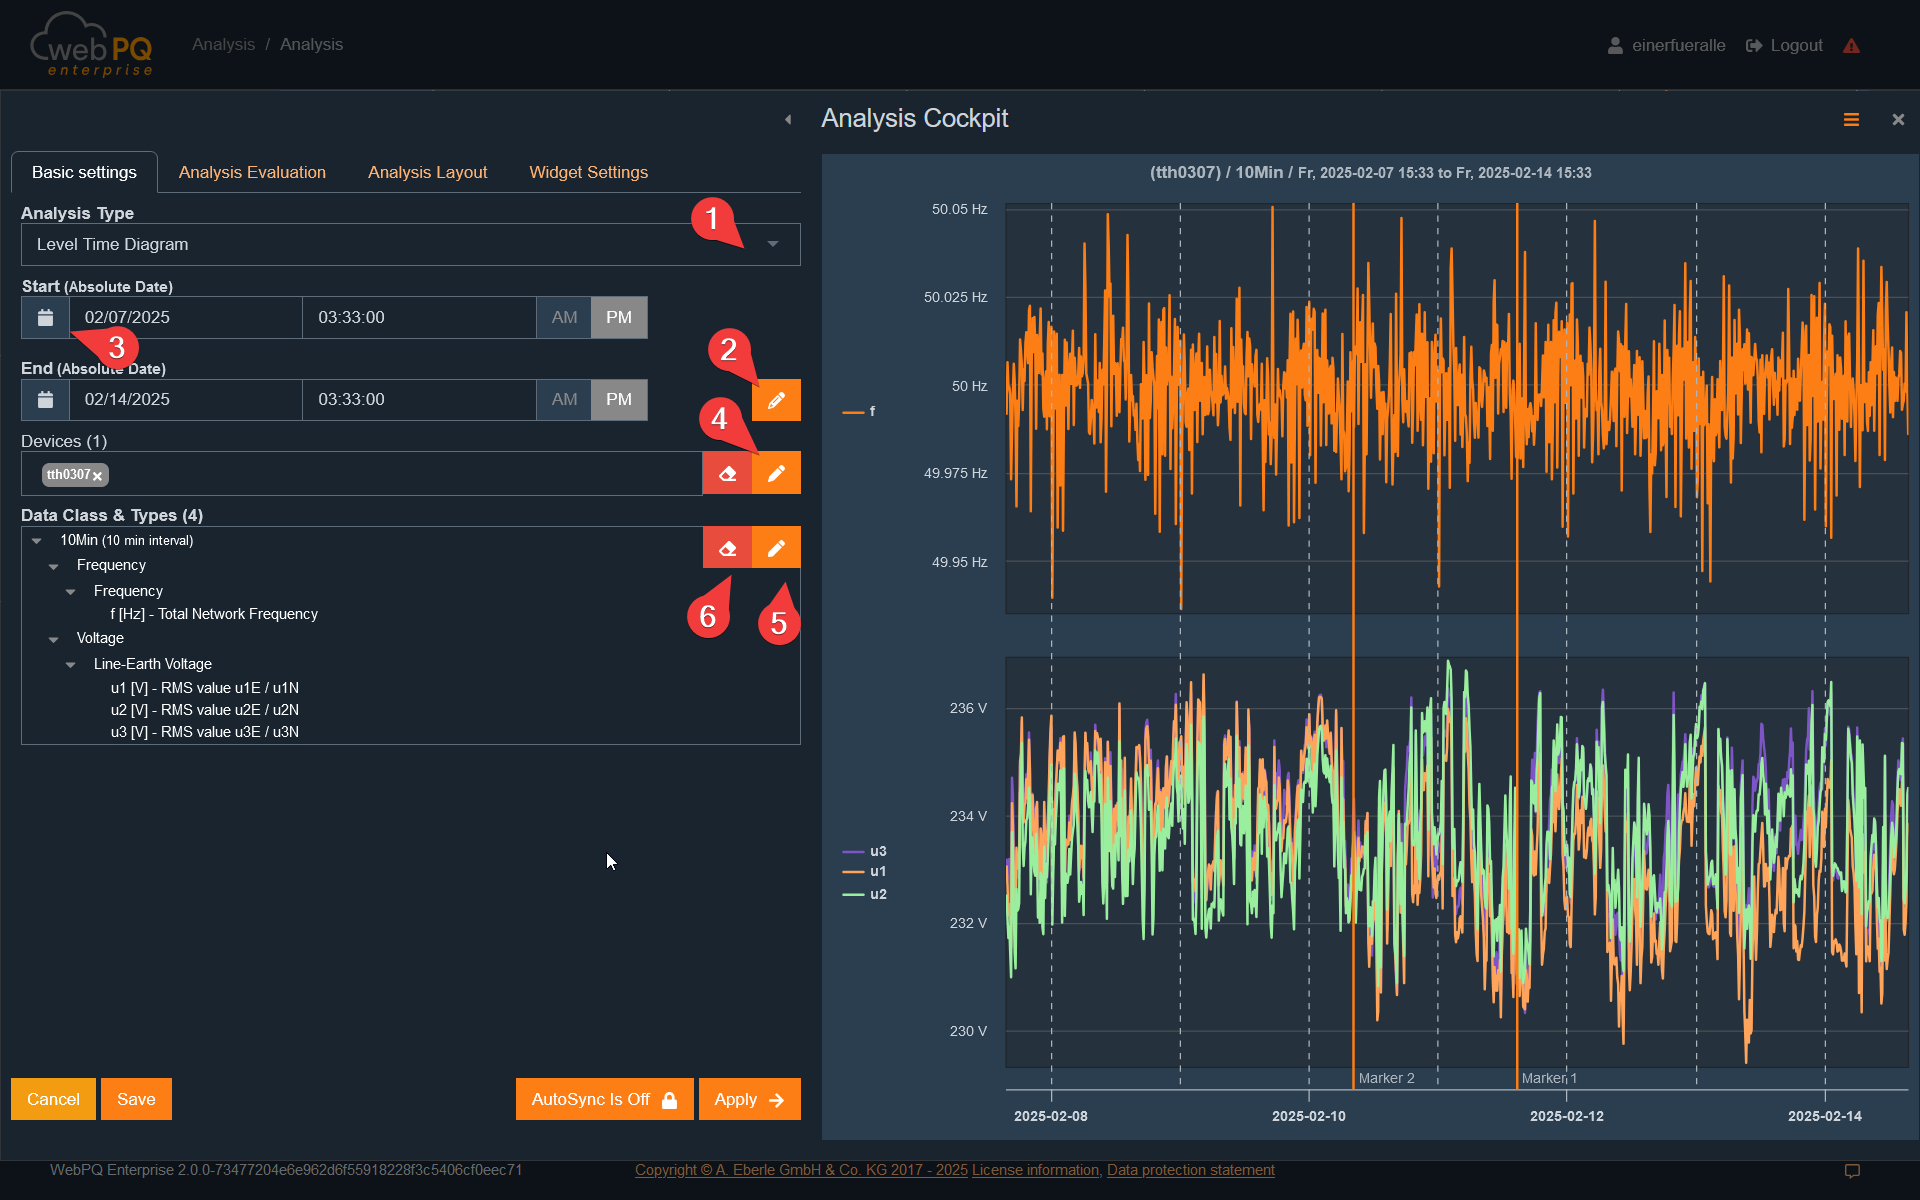
With the time setting#2, you can open a dialog to configure the analysis period. If an absolute period has been defined in the
menu, it can be set either by directly entering the start and end time under #3 or via the input fields.
In the device section #3, select the devices to be evaluated. This can be done by entering the device ID or using the selection list by clicking #3. The list shows all devices available in the database.
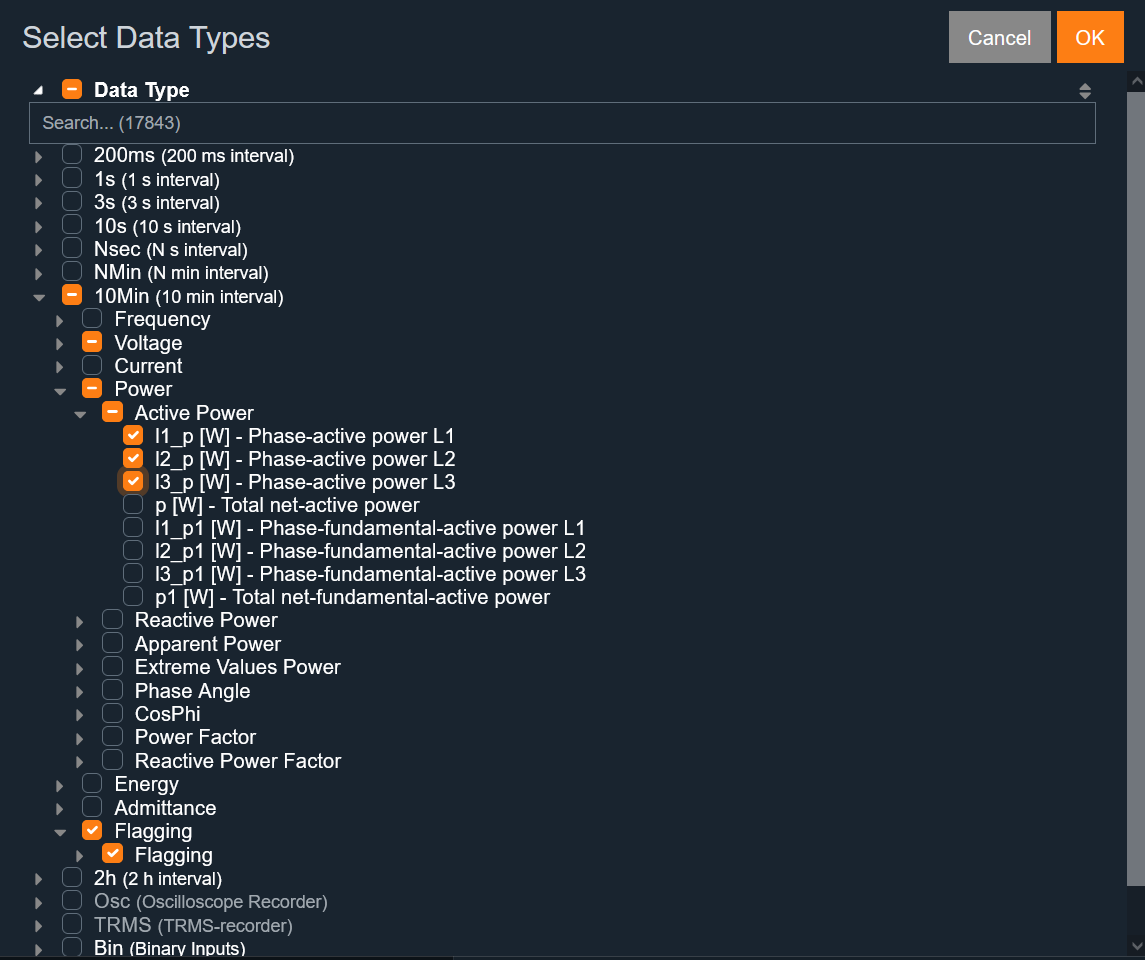
Using the measurement variable tree#5, select the measurement values recorded by the chosen devices during the selected period and transferred to the database. The selection can be reset with #4.
Depending on the analysis type, specific parameters must be considered for correct evaluation. These are explained in the following sections.
The level-time diagram displays selected measurement values as a line chart over a defined period. It is ideal for temporal analysis of measurement values and their changes.
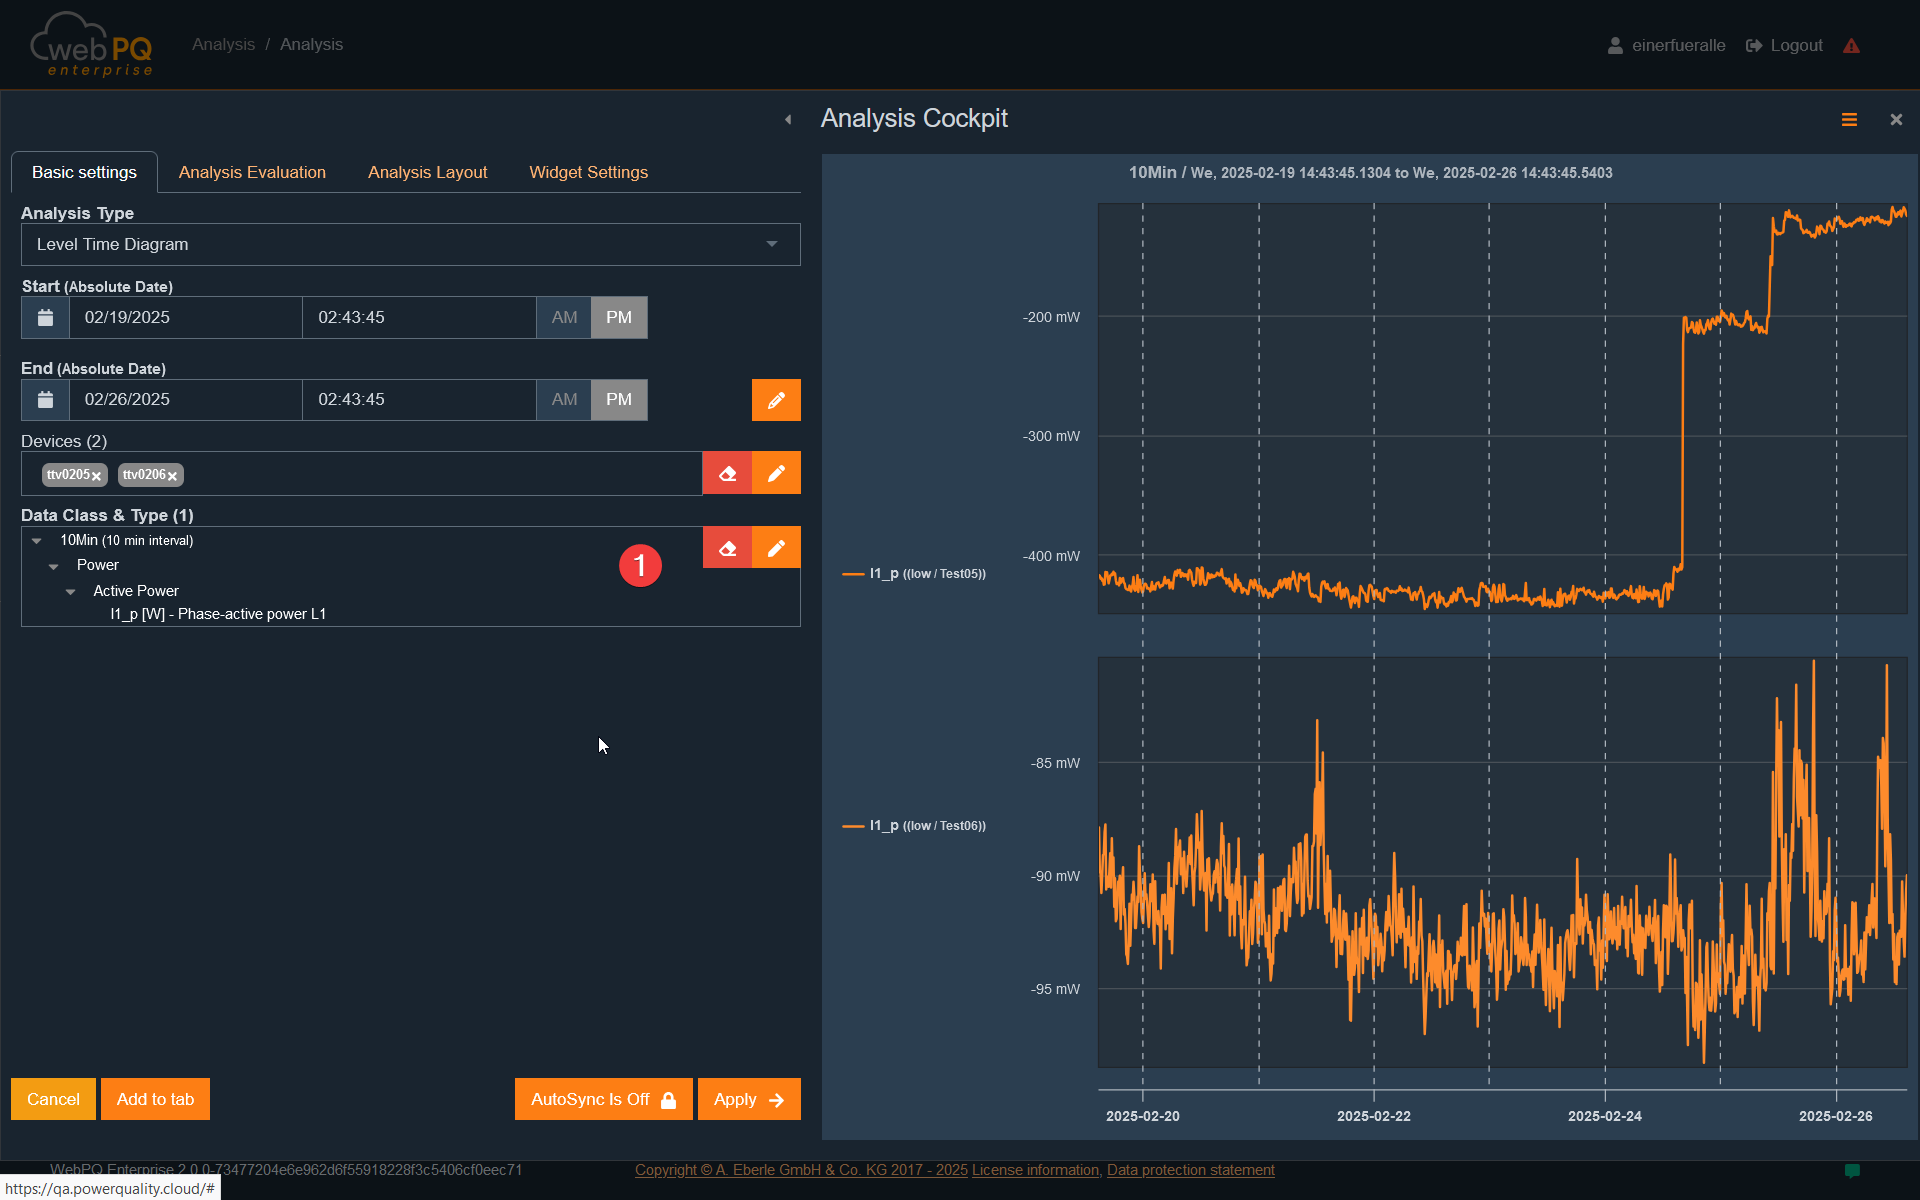
A special feature is the integration of flagging according to IEC61000-4-30 Class A. If enabled, flagging information is shown directly in the measurement variable tree #1 within the measurement series.
Measurement variable selection is dynamic: It is based on the intersection of available data, restricted by parameters such as period and selected devices.
See also: Time settings for experts
In the "Analysis Evaluation" tab, you can display the thresholds stored in the measuring device for the selected measurement variables. From version v2.1, alternative threshold sets can also be selected and applied to the measurement data.
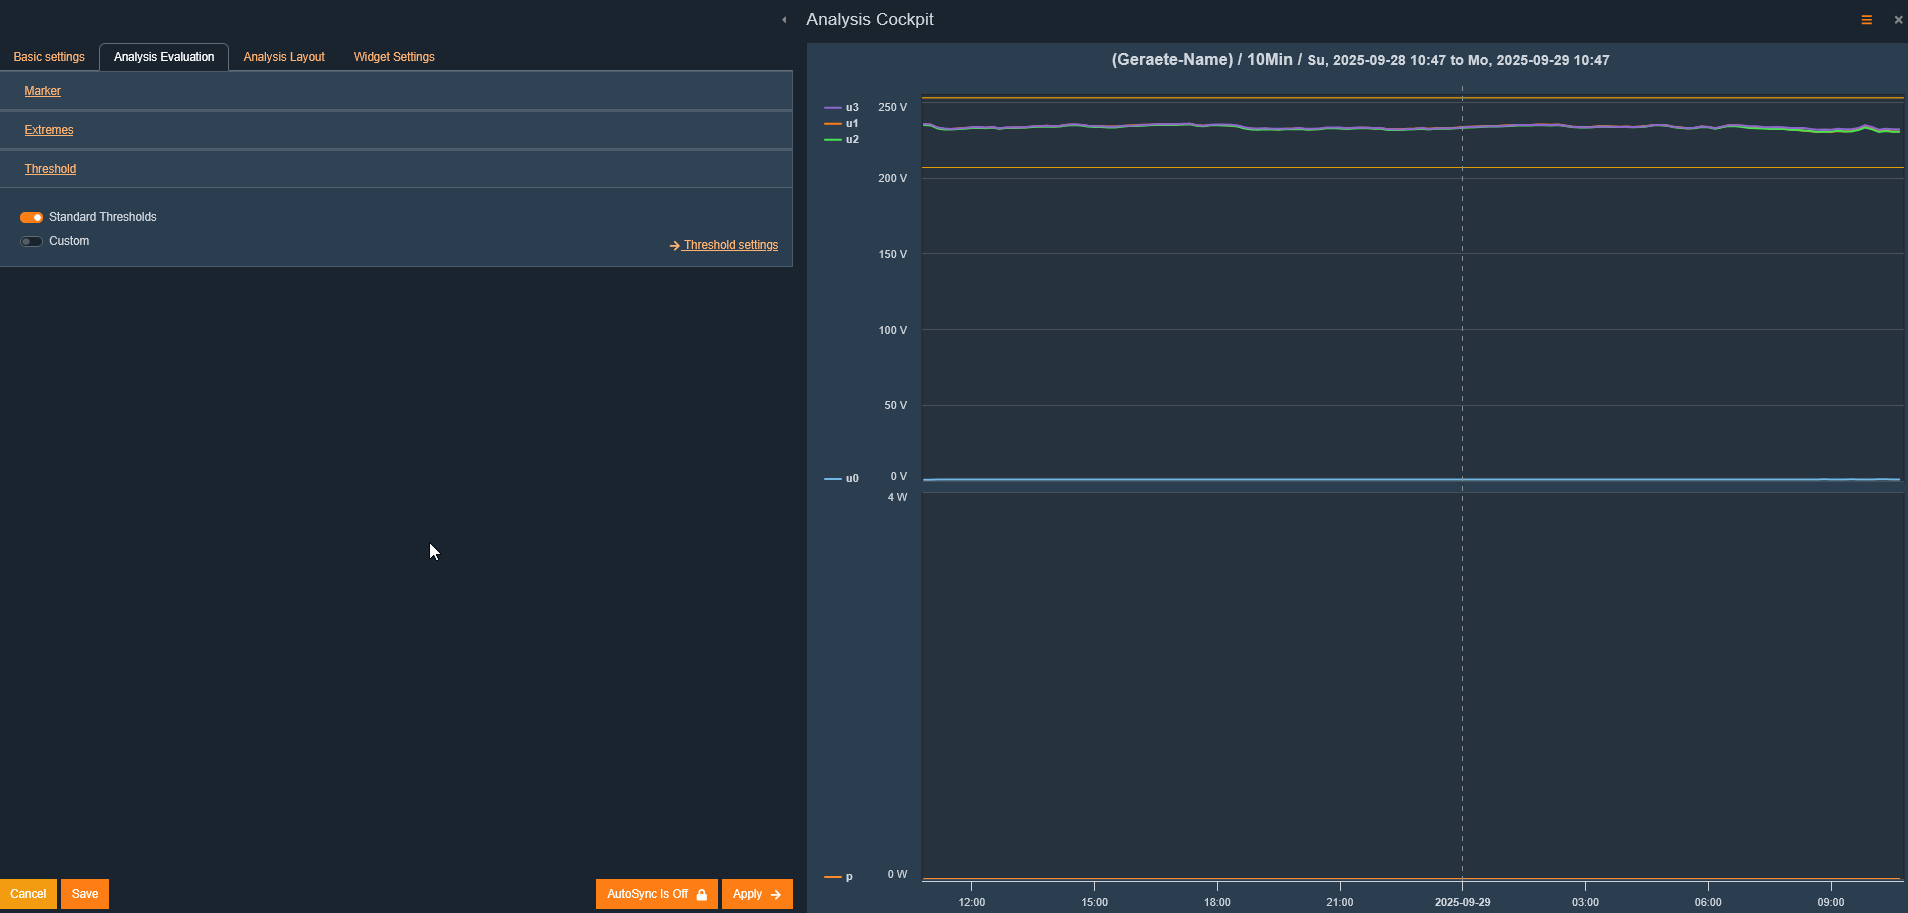
To show thresholds, select either the standard thresholds #1 or the extended threshold sets #2. Thresholds are then automatically displayed in the chart.
Extended threshold sets can be customised and managed in Reports > PQ Standard Templates. You can create, edit, or delete threshold sets there.
Flagging is visualised as a normal measurement value and displayed in the measurement series.
In the level-time diagram, up to two markers can be set for detailed examination:
Set marker:
A left-click on a data point adds a marker.
Up to two markers can be set at once to compare differences between measurement values.
Remove marker:
Clicking a set marker again removes it.
Marker values are automatically displayed in analysis evaluation and can be used for further analyses.
The PQ events over time diagram visualises recorded and selected power quality (PQ) events within the defined time range.
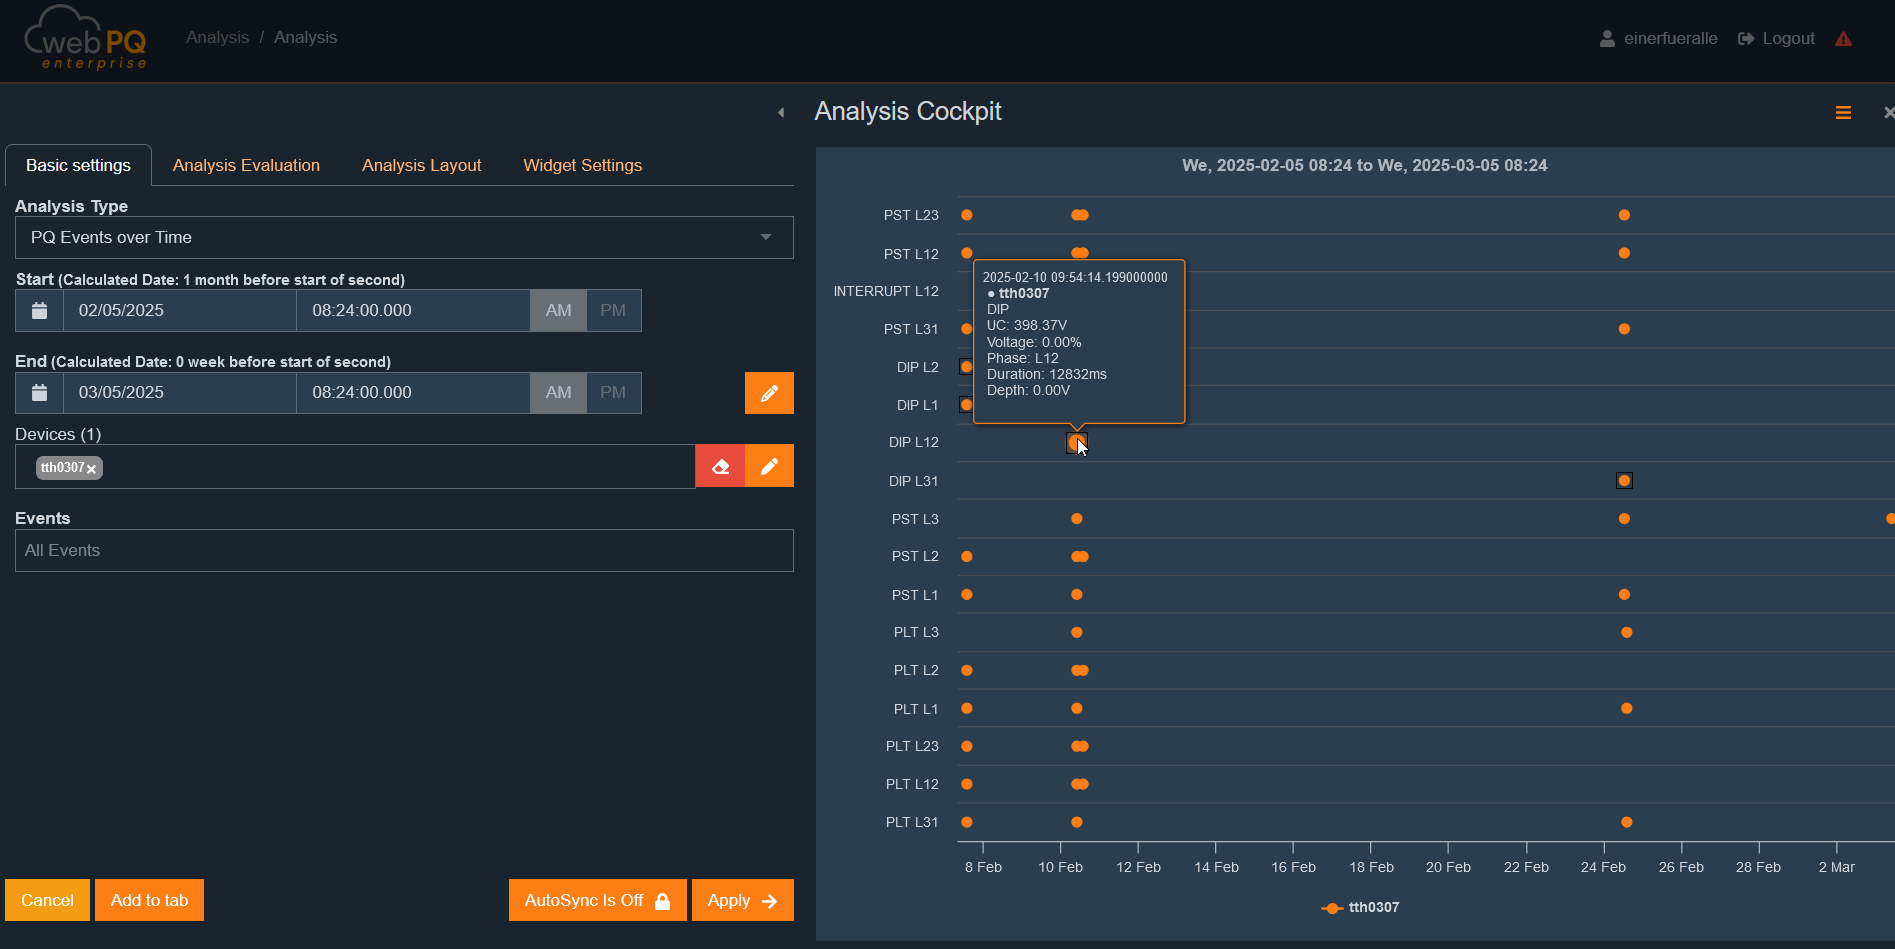
Retrieve detailed information:
Hovering the mouse over an event displays additional info, such as the height or depth of the event or other relevant measurement values.
Compare multiple PQ events:
The temporal view makes it easy to identify patterns and clusters of events.
Notable events can be further investigated via the Analysis Cockpit.
The histogram shows the statistical distribution of a selected measurement variable within a defined period.
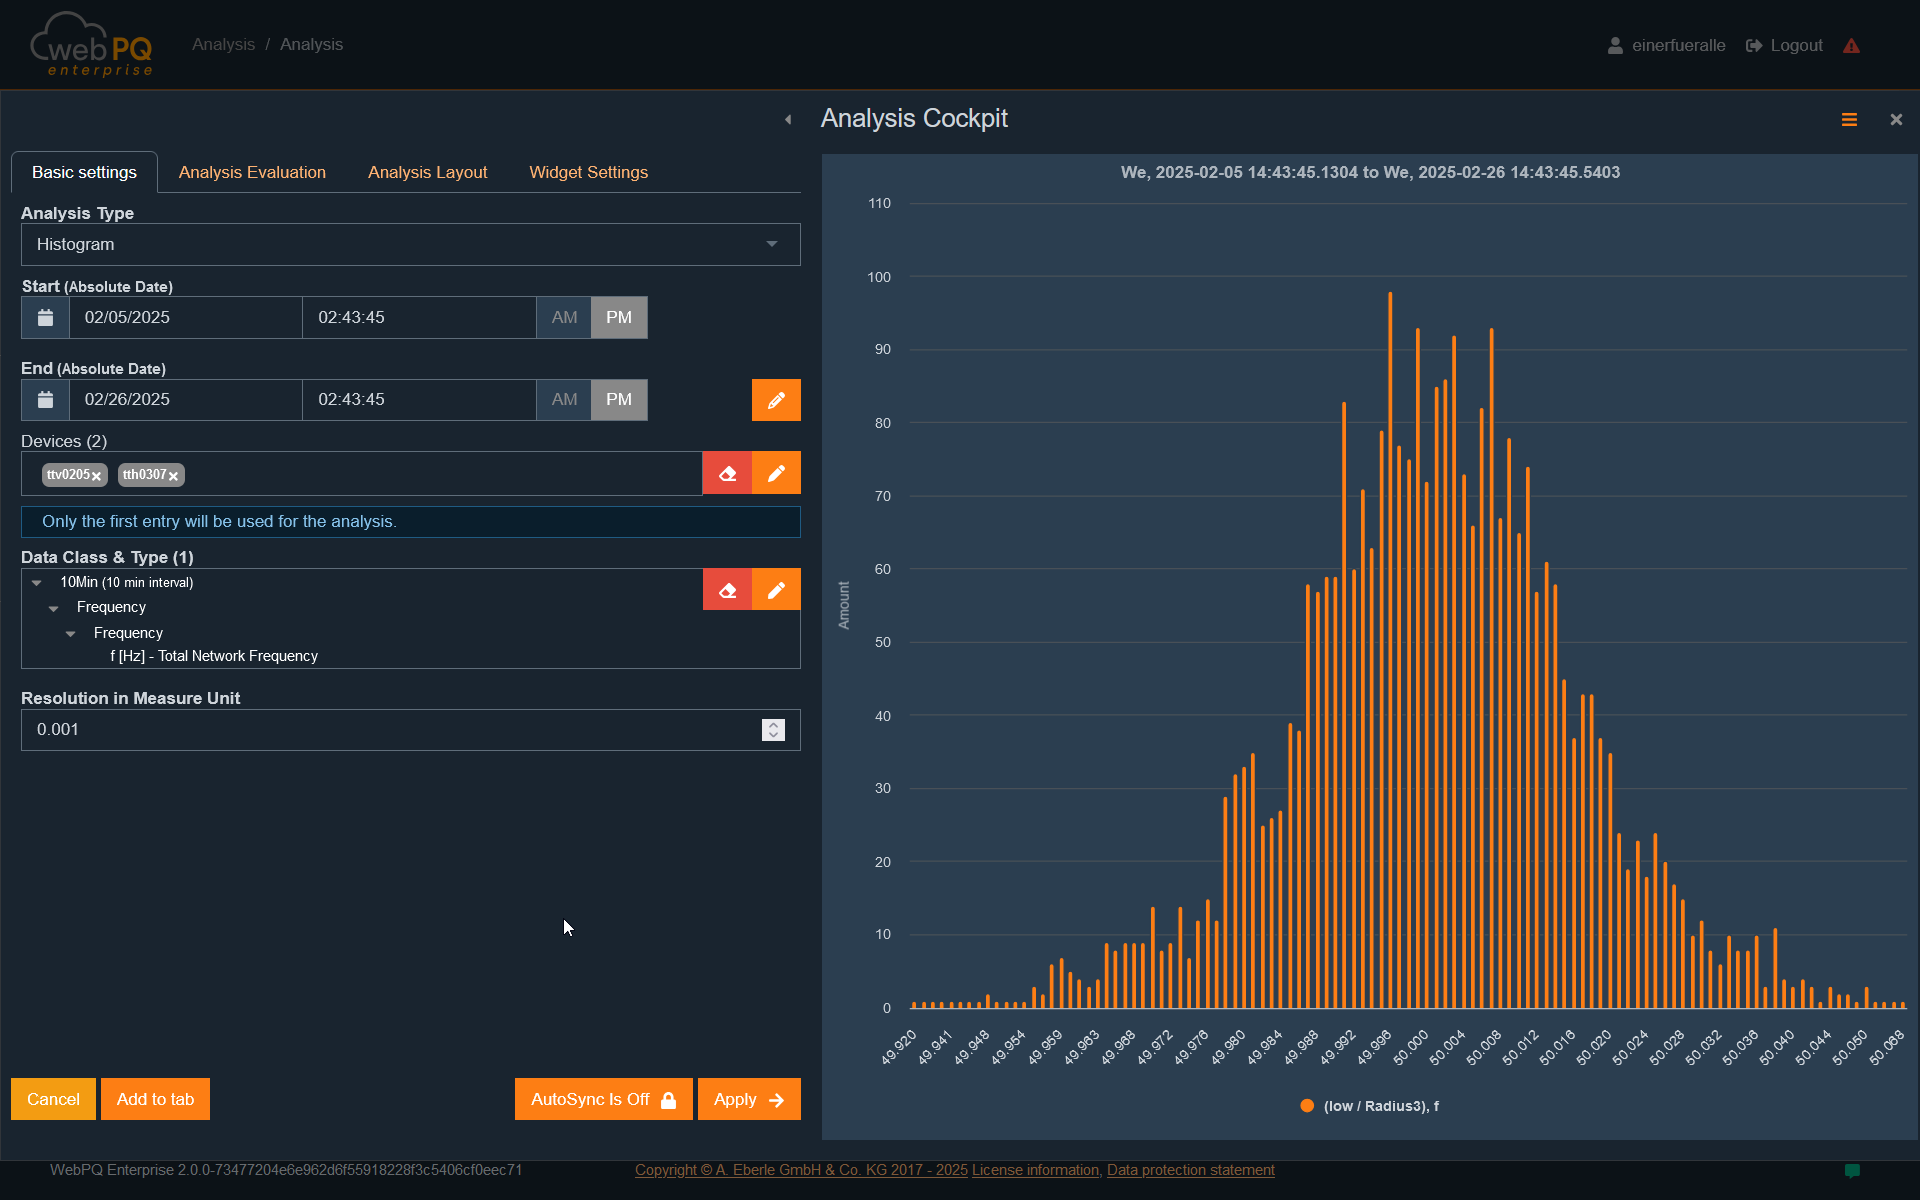
Select measurement variable:
In this example, frequency#1 was chosen.
Calculate distribution:
Data was grouped into 10-mHz bins over the selected period #2 and displayed as a frequency distribution.
Application areas:
The histogram helps identify deviations from expected values.
Unexpected peaks or asymmetries may indicate anomalies or systematic errors.
The scatter plot visualises the relationship between two selected axis values as a cloud of points. Each point represents one individual measurement record. This analysis type is especially useful for spotting correlations, clusters, outliers, and distributions quickly.
Unlike the level-time diagram, the scatter plot focuses on the relationship between two characteristics instead of their temporal progression. This makes it easier to compare measurement variables directly or structure data by device, tag category, or plot group.
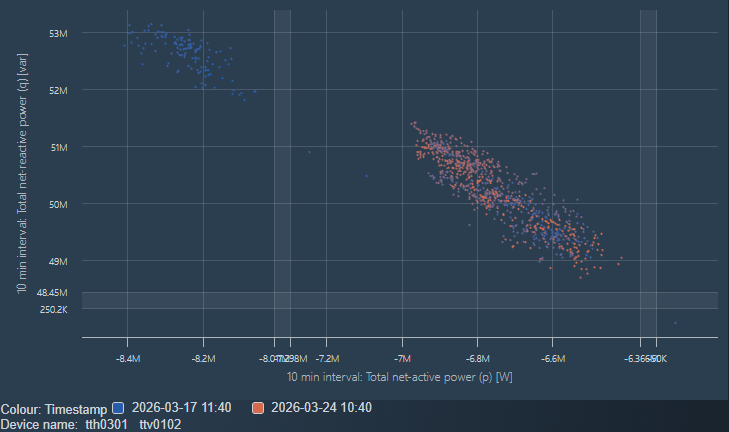
Compare two measurement variables, for example active power against reactive power
Identify typical operating states through cluster formation
Find outliers or unusual operating states
Compare multiple measuring points or groups in one shared chart
X axis and Y axis: define which values are plotted against each other
Plot groups: allow multiple data sources or configurations to be combined in one view
Color axis: adds another visual distinction for points, for example by measurement variable, device, or group
Shape axis: provides an alternative visual grouping through different marker symbols
Automatic gap cutouts: compress large empty axis areas so relevant point clusters stay readable
The FFT Spectrum analysis is used to inspect the frequency spectrum of oscilloscopic measurement data. It is useful when periodic signal components, resonances, or dominant frequency bands need to be identified directly from time-domain recordings.
The selected device must provide oscilloscopic measurement data.
FFT-specific options become available only when suitable oscilloscopic data types are selected in the measurement-variable selection.
Historical FFT uses the selected analysis interval. Live FFT requires an active live-data stream.
Historical FFT is based on stored oscilloscopic data in the selected time range. It is suitable for analysing already recorded events or archived oscilloscopic measurements.
Select the device and the oscilloscopic measurement variables to evaluate.
Define the analysis interval in the Analysis Cockpit.
The resulting chart shows the frequency on the X-axis and the magnitude on the Y-axis.
Multiple selected data types are displayed together in the same spectrum view.
This analysis helps identify characteristic frequencies after a disturbance and compare the spectral content of different oscilloscopic channels.
In addition to historical FFT, WebPQ also provides Live FFT as a dedicated live analysis type.
Live FFT subscribes to live oscilloscopic data of one selected device.
The spectrum updates continuously as new live samples arrive.
The chart can be zoomed horizontally to focus on relevant frequency ranges.
Device naming follows the currently configured device-name and hierarchy display settings.
Live FFT is useful for observing changing spectral content while a signal is still being streamed.
Depending on the selected oscilloscopic data, additional FFT options are available in the parameter area:
Time Window Mode controls how the FFT window is derived from the signal.
A fixed time window width can be configured when the fixed-window mode is selected.
If no suitable oscilloscopic data is selected, FFT-specific controls remain hidden.
Detect dominant harmonic or interharmonic components in oscilloscopic signals.
Compare live and recorded spectral behaviour.
Investigate resonances, converter-related frequencies, and recurring oscillations.
Narrow down disturbance sources before switching to a more detailed time-domain analysis.
The Custom Threshold Utilization Report compares the maximum measured values of the selected interval with the configured maximum values of custom threshold settings. It is intended for quickly identifying devices that already use most of their individual threshold reserve.
At least one device and a valid analysis interval must be selected.
At least one custom threshold setting must also be selected.
A custom threshold only produces usable results if it is assigned to the device and matching data class, and if a maximum threshold value is configured.
The analysis is shown as a table. Depending on the selected view, it includes in particular:
the title of the evaluated measurement value,
the assigned threshold name,
the unit,
the measured maximum value in the selected interval,
the configured threshold maximum,
the utilization in percent,
and the remaining reserve.
The default sorting is by the highest utilization. With Advanced view, additional columns such as the unit can be shown.
Clicking the threshold name opens the corresponding custom threshold settings.
Clicking the measured maximum value opens the Analysis Cockpit with the corresponding time-series analysis and custom thresholds already enabled.
Sorting and filtering are available as long as the analysis is not rendered as a printed report.
Utilization is shown as a colored progress bar:
below 60%: green
60% to 74%: yellow
75% to 84%: orange
85% or more: red
This makes it easy to identify critical devices at a glance.
If a value cannot be calculated, the table shows a warning indicator with the corresponding explanation. Typical reasons are:
No valid measurement data is available in the selected interval.
No maximum threshold is configured in the selected custom threshold.
No matching custom threshold is assigned to the device and data class.
The available threshold data is not sufficient to calculate the result.
Identify measurement points with little remaining reserve to custom thresholds.
Compare several devices within one common time interval.
Jump directly from the overview into the matching time-series analysis or the threshold settings.
Voltage and current harmonics are displayed as bar charts to provide a quick overview of the entire frequency spectrum to be monitored.
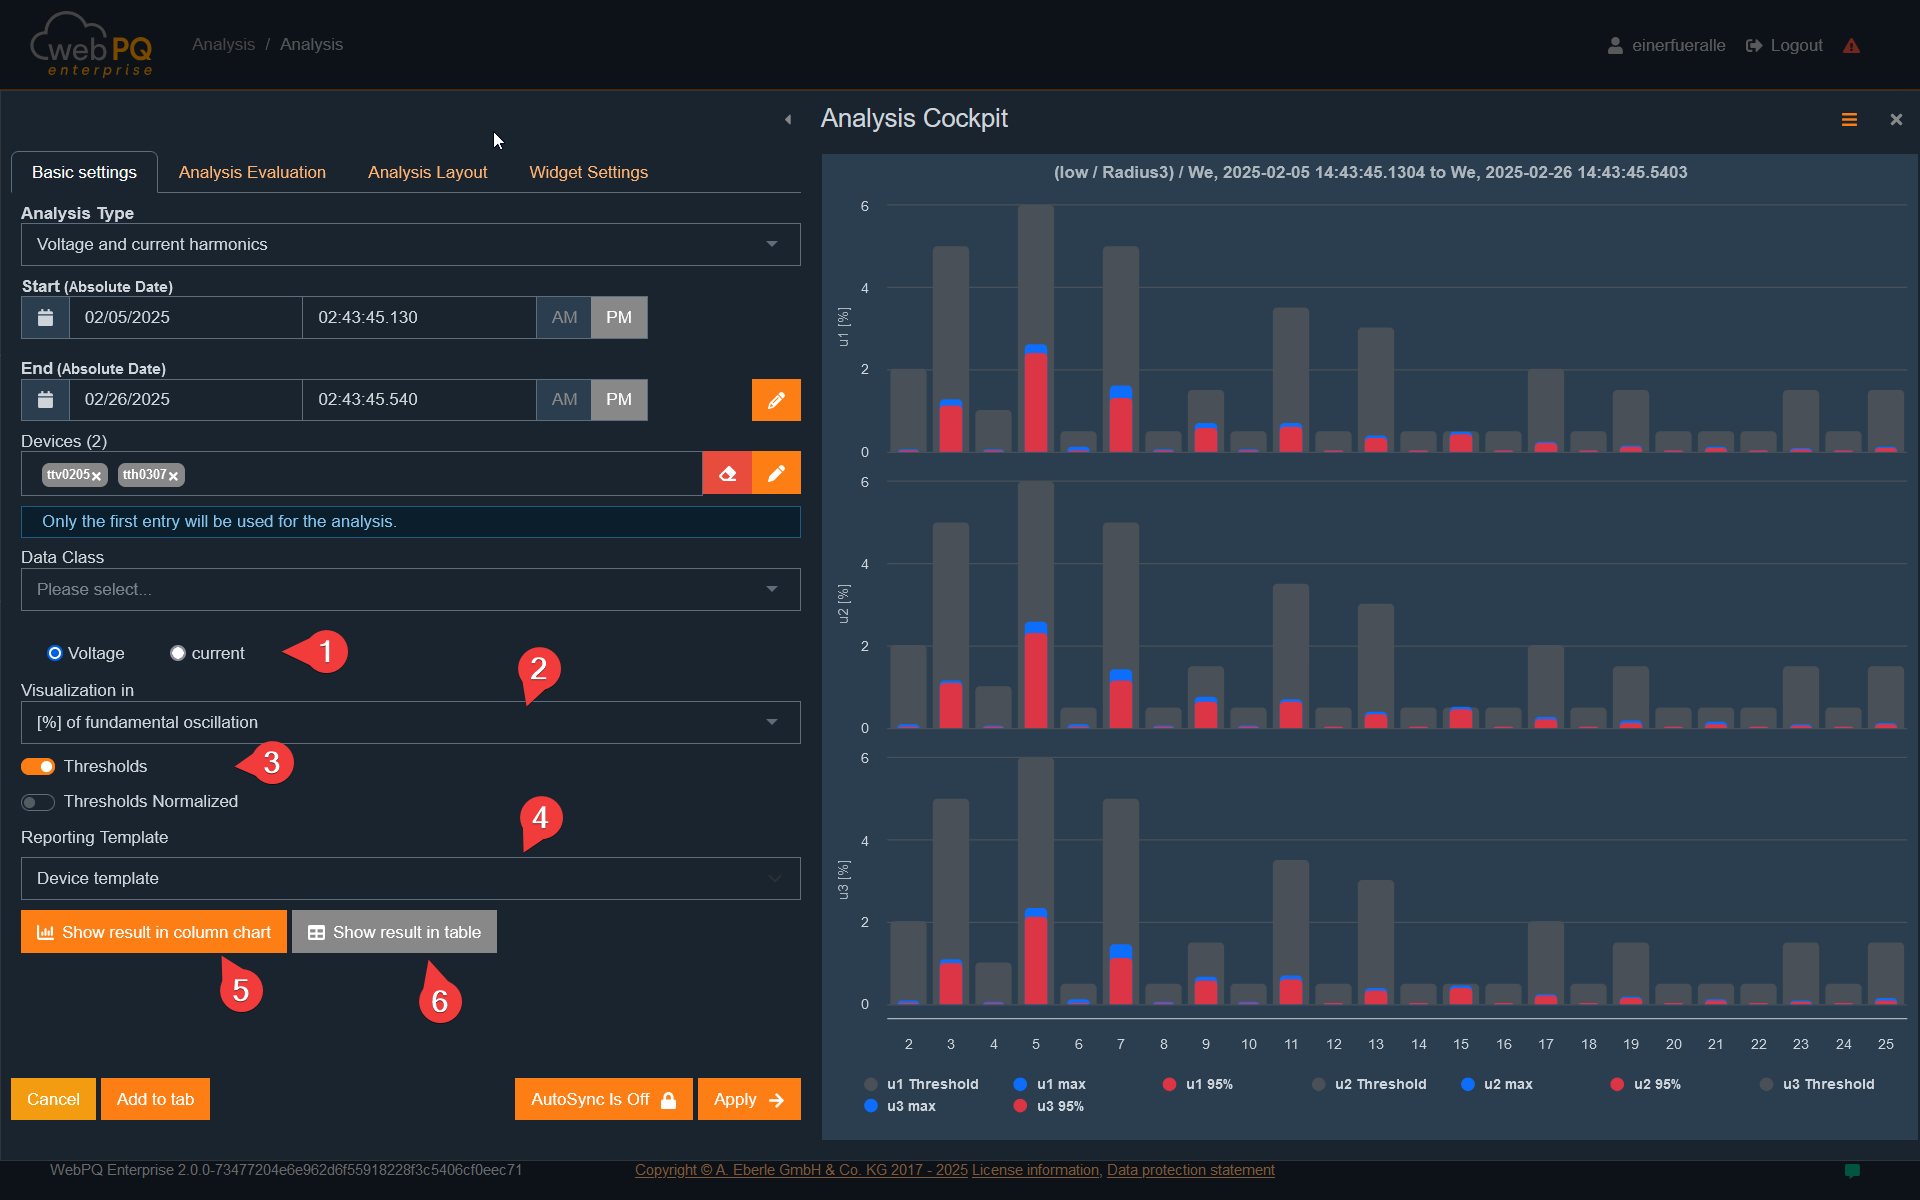
Colour-coded bars for quick analysis:
The red area of a bar shows the percentage quantile set by the standard.
For low voltage, this is typically 95% of measurement values per week for harmonics.
The blue area represents the maximum measured value in the selected period.
Interactive detail view:
Clicking a specific harmonic switches from the bar overview to a detailed temporal view.
Switch between voltage and current harmonics:
Via #1, switch between voltage and current view.
The display can be adjusted depending on the measurement variable:
Voltage:
Relative to the fundamental wave [%] – Used in normative contexts.
As absolute value [V] – Used for troubleshooting.
Current:
Relative to nominal current [%] – Used in IEEE standards.
Relative to the fundamental wave [%] – Used in IEC standards.
As absolute value [A] – Used for troubleshooting and filter technologies.
Depending on the selected visualisation method, additional settings are shown or hidden to optimise analysis.
This analysis is useful for:
Detecting and evaluating harmonics that may cause disturbances or power quality issues.
Comparing harmonics over different periods to identify long-term trends.
Evaluating compliance with standards, e.g., EN 50160 or IEC 61000-2-4.
Measuring devices from A. Eberle GmbH provide current limit sets directly to the database. These limit sets form the basis for analyses and reports.
Since harmonic limits are percentage values based on recorded aggregation levels, alternative limit sets can be applied to existing data in the UI.
Select limit set:
Via #4, select a specific limit set for analysis.
In "Reports" > "PQ Standard Templates", limit sets can be customised and managed.
Display limits in visualisation:
When a limit set is selected under #3, it appears in the graphical view.
Users can see at a glance whether and to what extent values exceed limits.
Switch between representations:
With #5 and #6, switch between:
Tabular view (with or without limits)
Bar chart view.
Evaluate power quality: Ensure network parameters remain within standard limits (e.g., EN 50160, IEC 61000-2-4).
Compare limits: Apply different limit sets to the same data to analyse various criteria.
Detect limit violations: Identify critical deviations indicating disturbances or network problems.
The "Supraharmonics" analysis shows – depending on device data – the supraharmonics in the context of the selected standard template and time range.
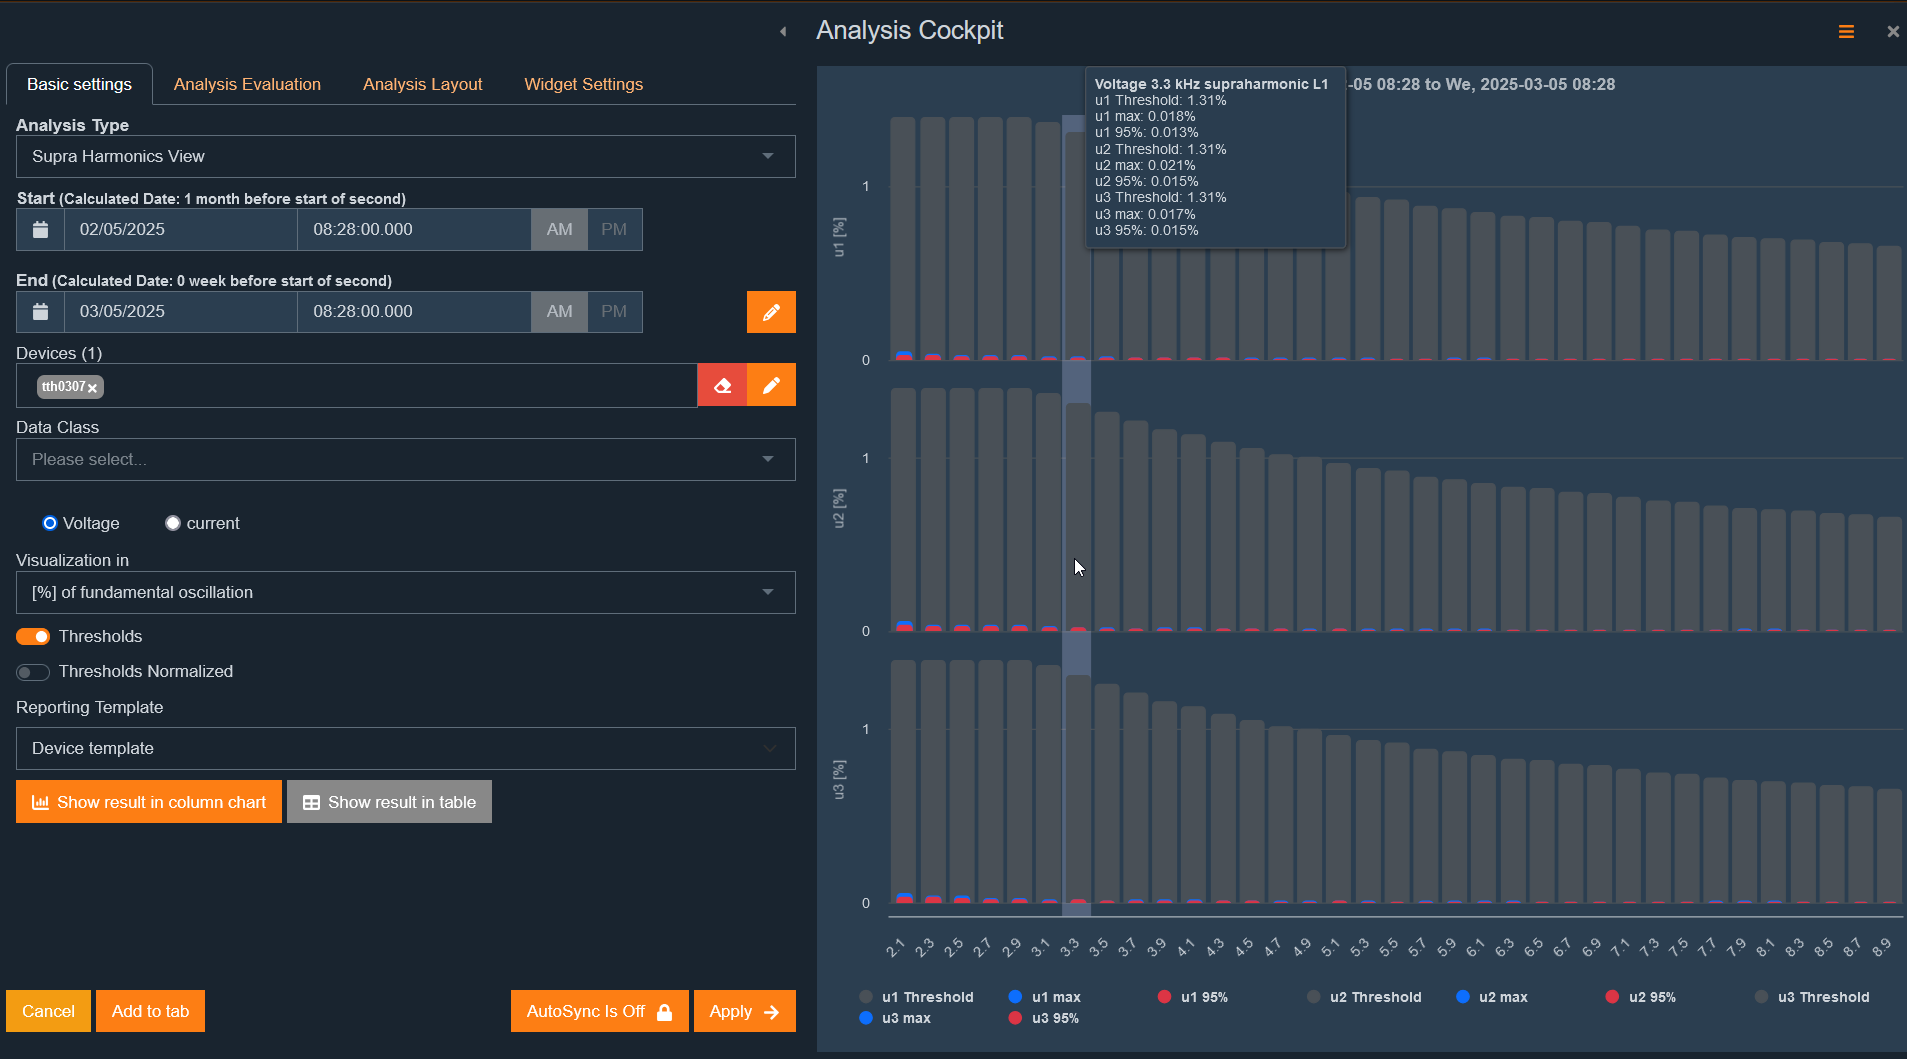
Determination follows IEC 61000-4-7 in 200-Hz frequency bands.
In the software, centre frequencies are always shown.
Example of frequency band division:
Centre frequency:2.3 kHz
Includes all 5-Hz spectral lines from 2205 Hz to 2400 Hz
Supraharmonics are visualised as bar charts.
The display can be adjusted according to standard requirements and analysis goals.
Supraharmonic analysis has the same functions as harmonic analysis:
Switch between visualisation types
Compare with limits
Tabular or bar chart view
Zoom and marker function for detailed analysis
Detect supraharmonics: Investigate higher frequency disturbances in the network.
Compare with standard limits: Check if measured supraharmonics are within permissible values.
Identify disturbance sources: Analyse frequency ranges with excessive supraharmonic voltages or currents.
Optimise filter solutions: Evaluate filter effectiveness to reduce disturbances.
Interharmonic analysis investigates voltage and current components not in an integer ratio to the fundamental frequency.
Interharmonics are visualised as bar charts.
Various display types can be selected:
Relative to the fundamental wave [%]
As absolute value [V] or [A]
Compared to defined limits
This analysis is relevant for evaluating harmonic distortions caused by frequency converters, electronic loads, or nonlinear consumers.
Functionality matches harmonic analysis and offers:
Comparison with limits
Zoom and marker function for detailed analysis
Switch between visualisation types in the drill-in process
Detect nonlinear network loads
Evaluate network quality according to IEC 61000-4-7
Identify disturbances from frequency converters and inverters
Evaluate network resonances and unexpected oscillations
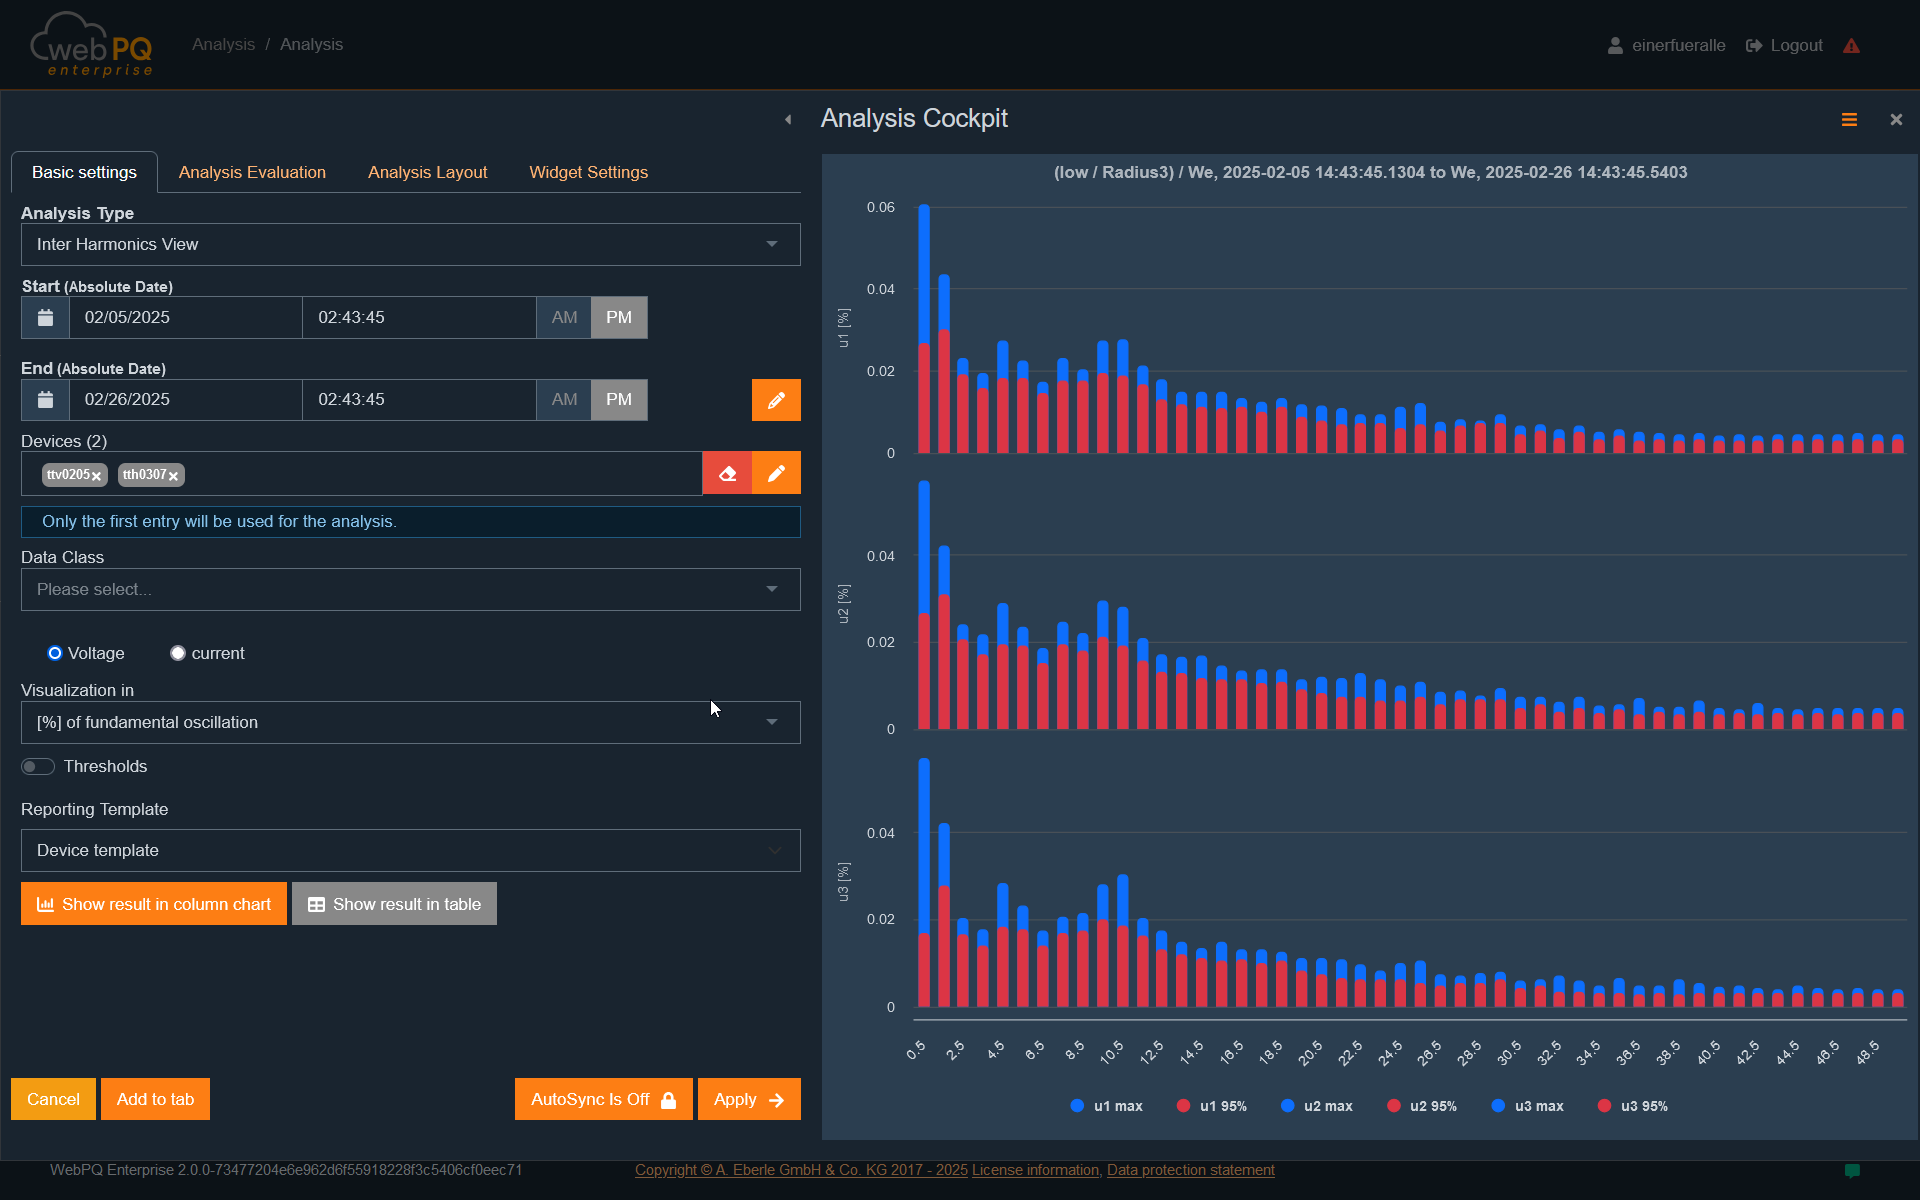
The normative report summarises all values required for evaluation according to the set standard templates in a clear analysis.
Results are available in two formats:
Bar chart – normalised to the respective measurement variable
Tabular report with detailed values
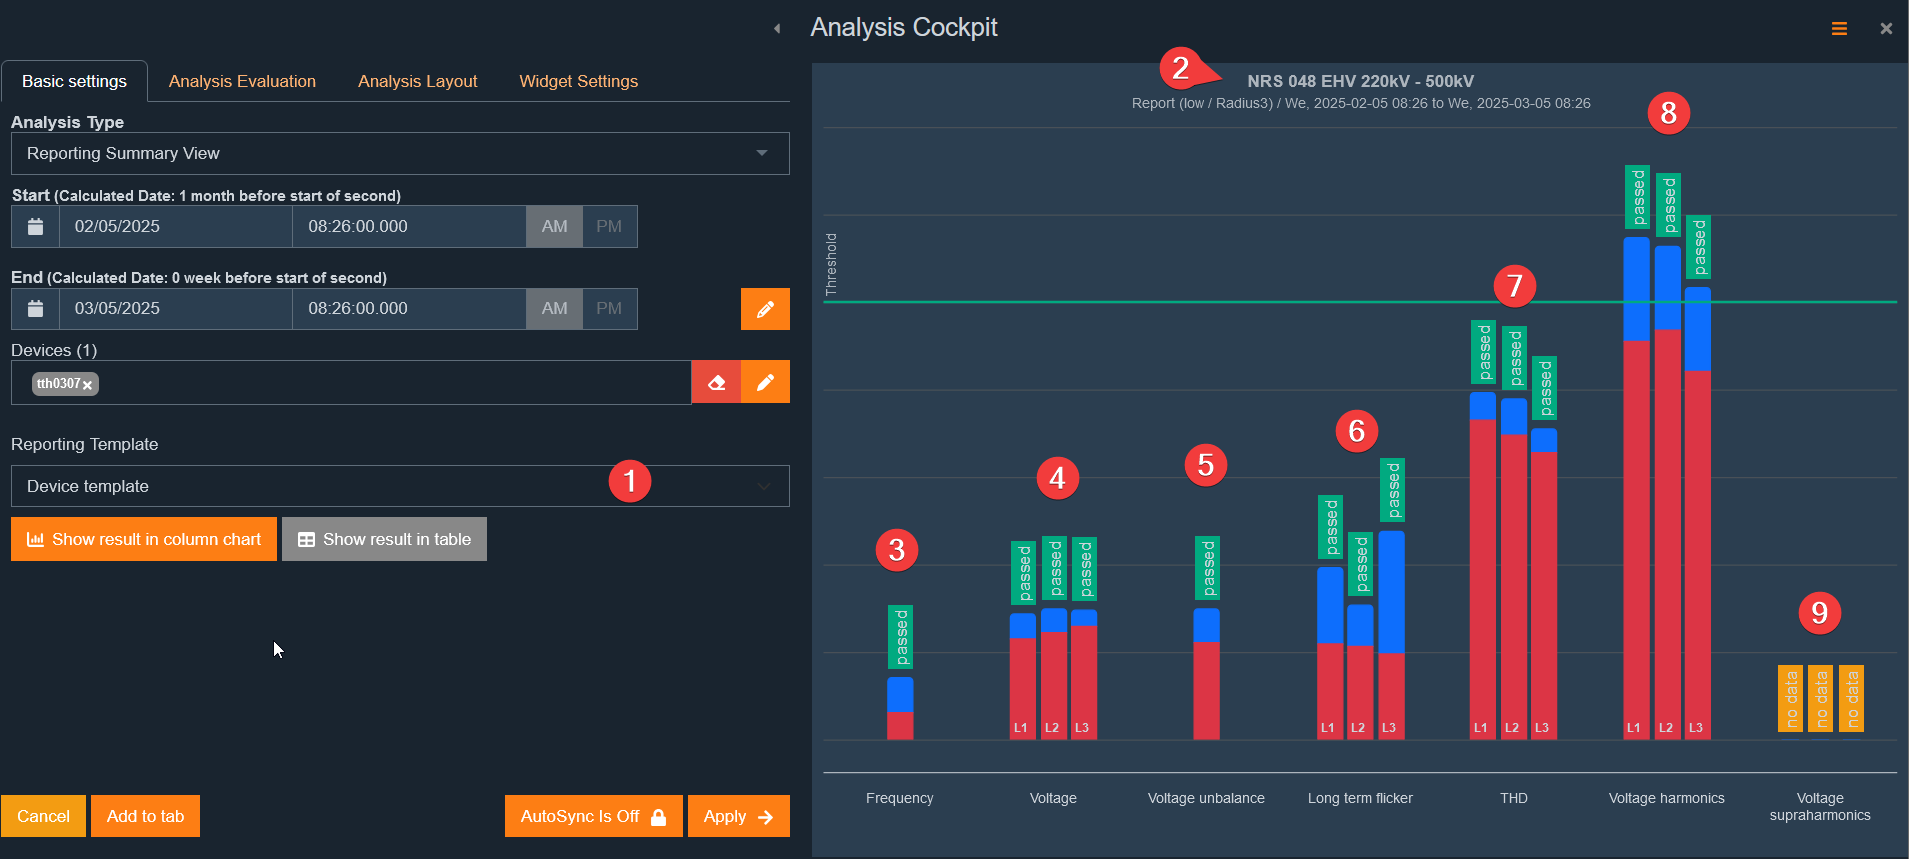
If no dedicated standard template is assigned to the selected device, the template provided by the device is used automatically.
The title is generated from the stored standard template of the device.
Depending on the template, specific measurement variables are included or excluded.
Examples:
A current EN50160 template contains individual harmonics up to H25 and no supraharmonics.
The IEC61000-2-2 standard for low voltage considers supraharmonics.
In the example shown, a combined template of EN50160 and IEC61000-2-2 is active, so supraharmonics are also displayed.
Various parameters are evaluated according to the set standard template. Each parameter is displayed with its limits.
#3)Network frequency must be between 49.5 Hz and 50.5 Hz according to EN and IEC.
The blue bar shows the maximum deviation from the upper or lower limit relative to the nominal limit.
The red bar shows the 99.5-percentile deviation of the frequency.

#4)Network voltage is evaluated relative to the nominal value.
Limits are based on the standard (e.g., ±10% of nominal voltage according to EN50160).
Blue marking shows maximum deviations.
Red marking represents 95% percentile values.
#5)Evaluates voltage unbalance between three phases.
Permissible limits depend on network level (e.g., max. 2% in low voltage).
#6)Measures visual voltage fluctuation (flicker).
Standard limit is usually PLT ≤ 1 for low voltage networks.
#7)THD evaluates overall harmonic distortion of network voltage.
Standard limit depends on voltage level, typically max. 8%.
#8)Shows highest values of individual harmonics.
Maximum value is displayed
Each harmonic is evaluated according to limits (e.g., H5 ≤ 6%).
#9)Shows distortions in the frequency range > 2 kHz.
Evaluation follows IEC61000-2-2 or other standards.
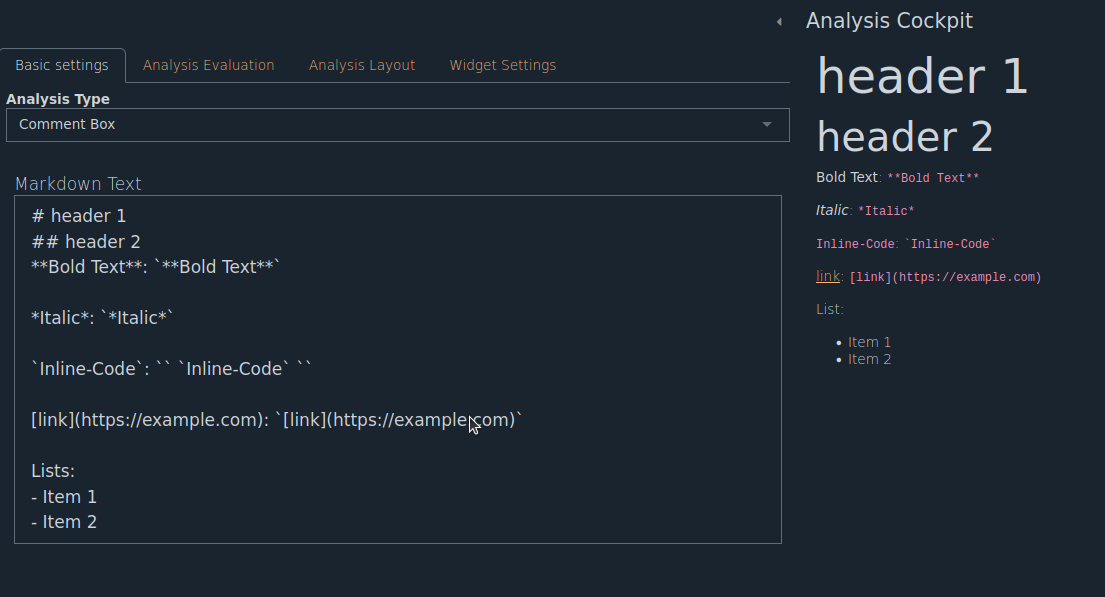
The comment box is used to add extra information or explanations to analyses created in the dashboard.
Add notes to an analysis.
Supports simplified Markdown for formatted text.
Comments can be saved, recalled, or edited later.
For simple formatting, Markdown syntax is used.
Examples:
Bold Text:
**Bold Text**→ Bold TextItalic:
*Italic*→ Italic
Inline code:`Inline code`→Inline codelink →
[link](https://example.com)Lists:
- Item 1
- Item 2
A full overview of Markdown syntax is available in the Markdown Cheatsheet.
Document specific descriptions and labels within an analysis.
Notes for other users or future evaluations.
Structure and comment on analysis results.
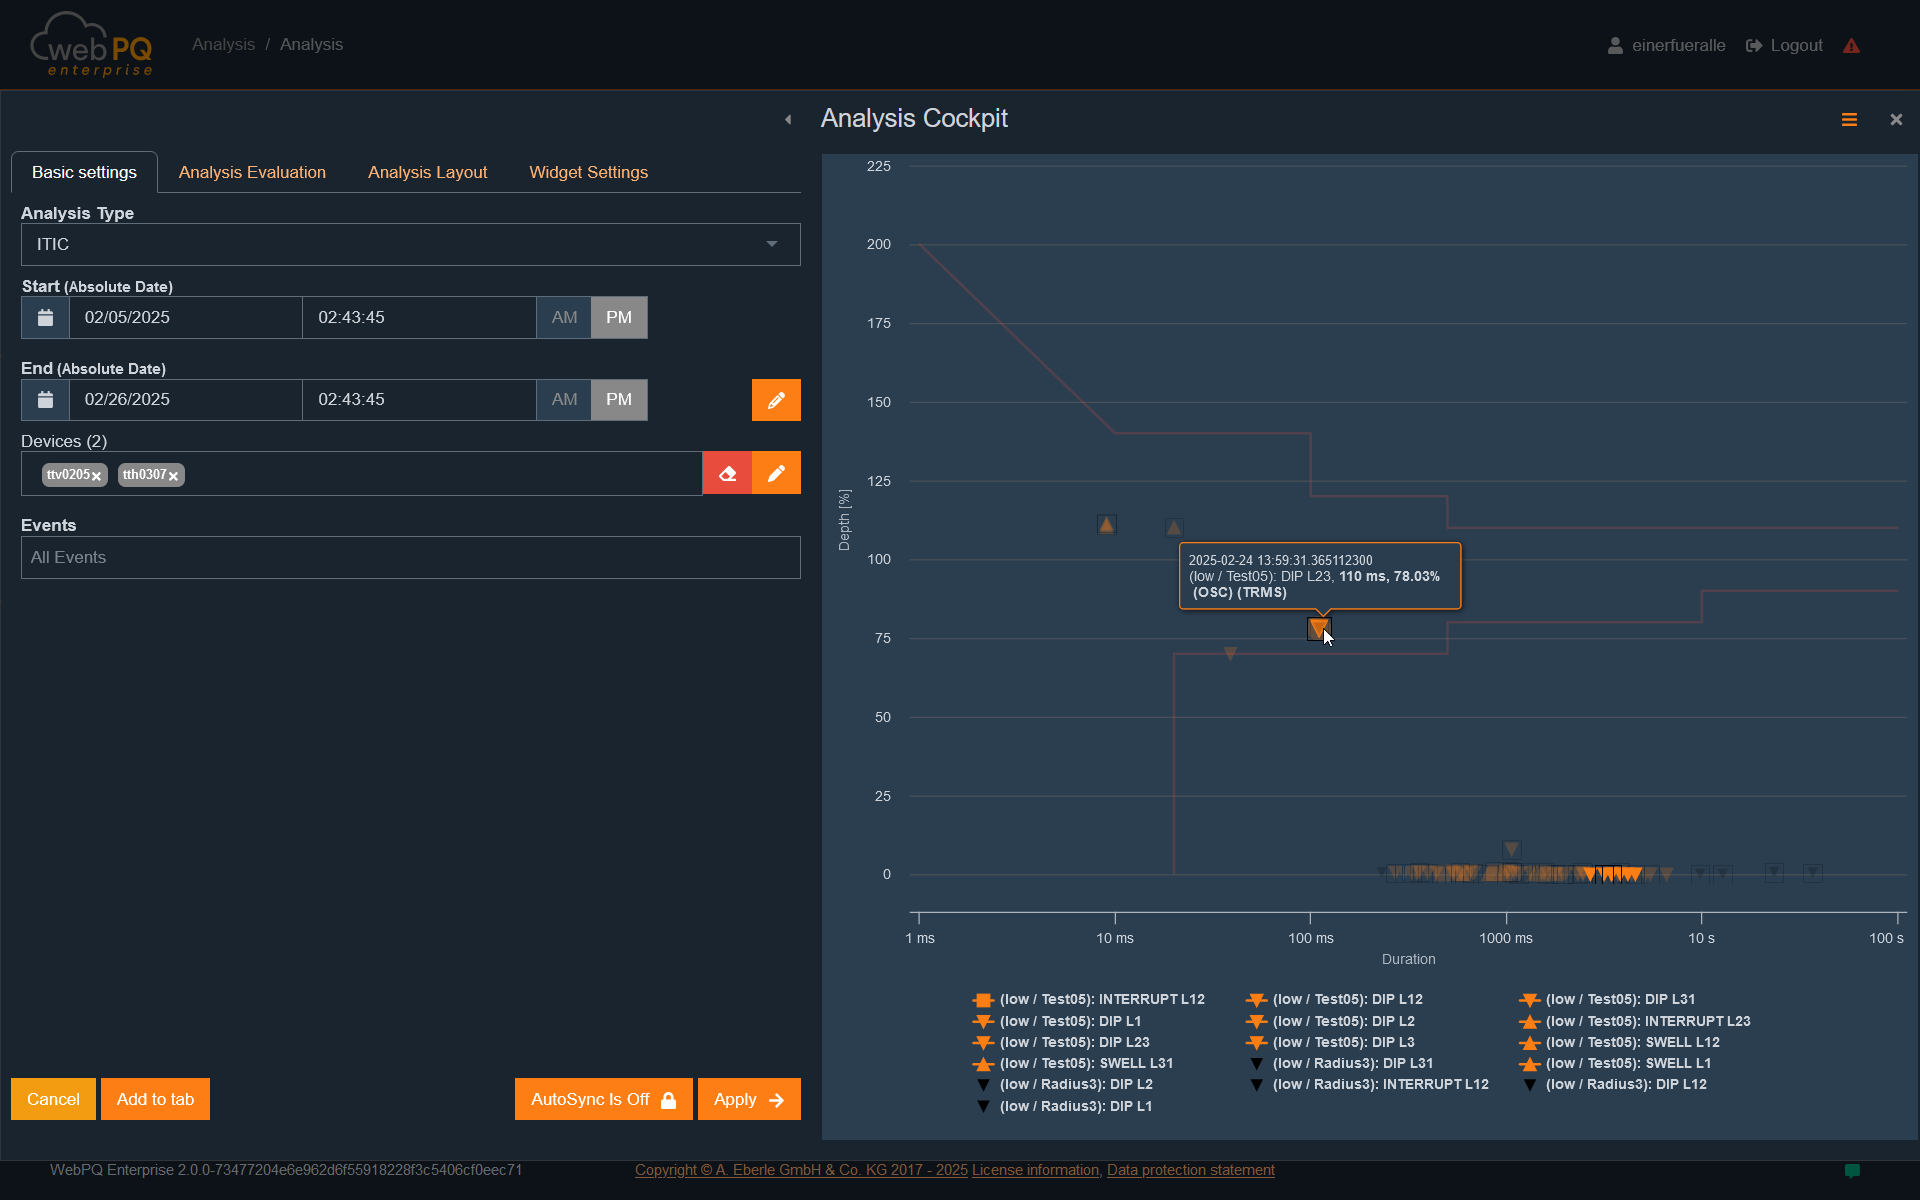
The ITIC (CBEMA) curve describes an AC input voltage typically tolerated by most information technology equipment (ITE).
All PQ events within the envelope curve should not cause interruption or damage to connected equipment.
The display is logarithmic on the X-axis and in percent on the Y-axis relative to the set nominal voltage of the device.
This allows both medium voltage and low voltage devices to be evaluated in parallel.
Multiple measuring points can be defined.
An individual period can be set.
Users can select and analyse specific PQ events.
If a power quality event such as a voltage dip triggers a disturbance record,
it can be opened and investigated directly by clicking the event.
This interactive display enables detailed fault analysis and quick problem identification.
The FRT curve (Fault Ride Through) illustrates how generation units such as photovoltaic or wind power plants can continue feeding into the grid during voltage dips. WebPQ enables graphical visualisation and analysis of FRT curve compliance according to country-specific grid codes. In "Report → Standard Templates → FRT Curve", the appropriate FRT curve for different countries and grid levels can be selected or defined. Measured voltage events are plotted against the FRT curve, making it easy to see whether the plant meets requirements. The FRT curve is an important tool for grid operators and plant owners to ensure grid stability and compliance with legal and regulatory requirements.
The FRT curve is typically displayed as a percentage of nominal voltage over time. It shows permissible voltage dips and the required duration for which a plant must continue feeding during these dips. The curve starts at 100% of nominal voltage and drops during an event. Depending on the grid code, requirements for depth and duration of the dip vary.
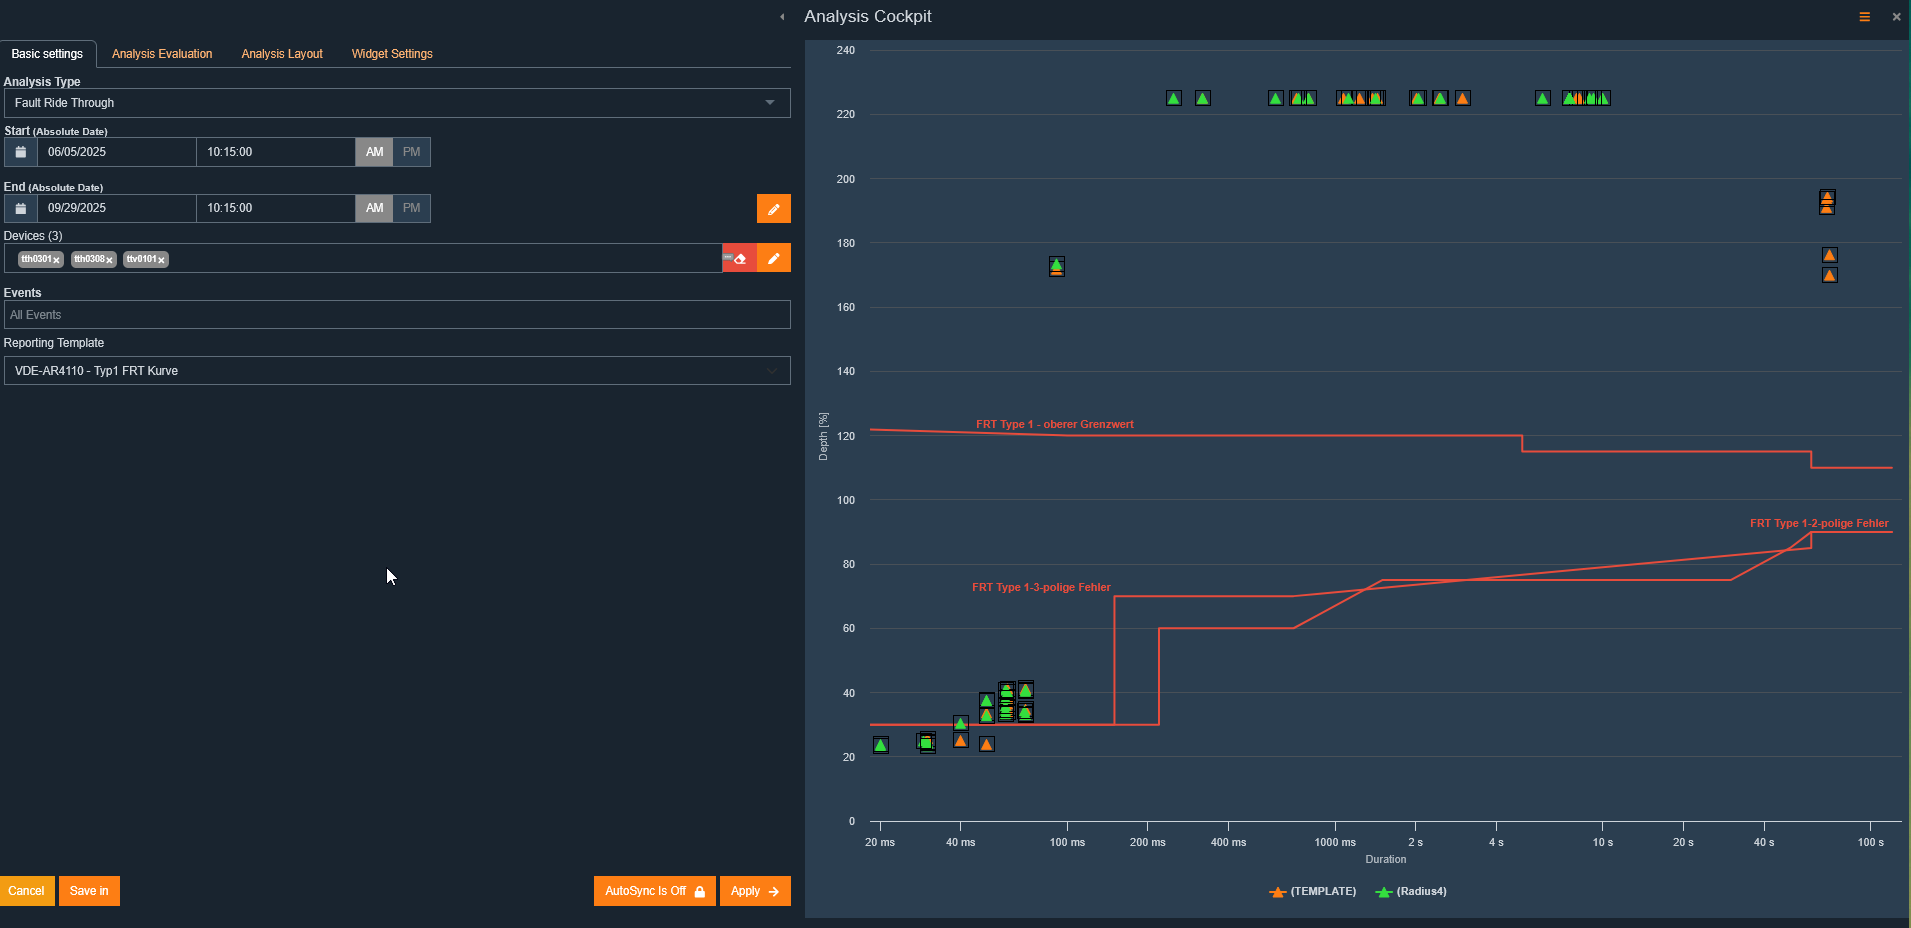
Plotted events are interactive: Clicking an event opens the corresponding disturbance record for detailed analysis.
In "Reports", go to "Standard Templates" and select "+Add"
Choose "FRT Curve" as the template type
Assign a name to the template, e.g., "My FRT curve"
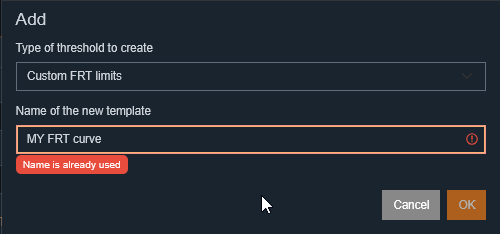
Enter a time point (#1) and a voltage level (#2) to define curve coordinates
Use "+" to add another coordinate (#3)
Use the "bin" icon to remove a coordinate (#4)
Use "+" to add new curves to the chart (+7)
Save the FRT curve (#6) to store it for future analyses
Delete the entire FRT curve using "Delete" (#5)
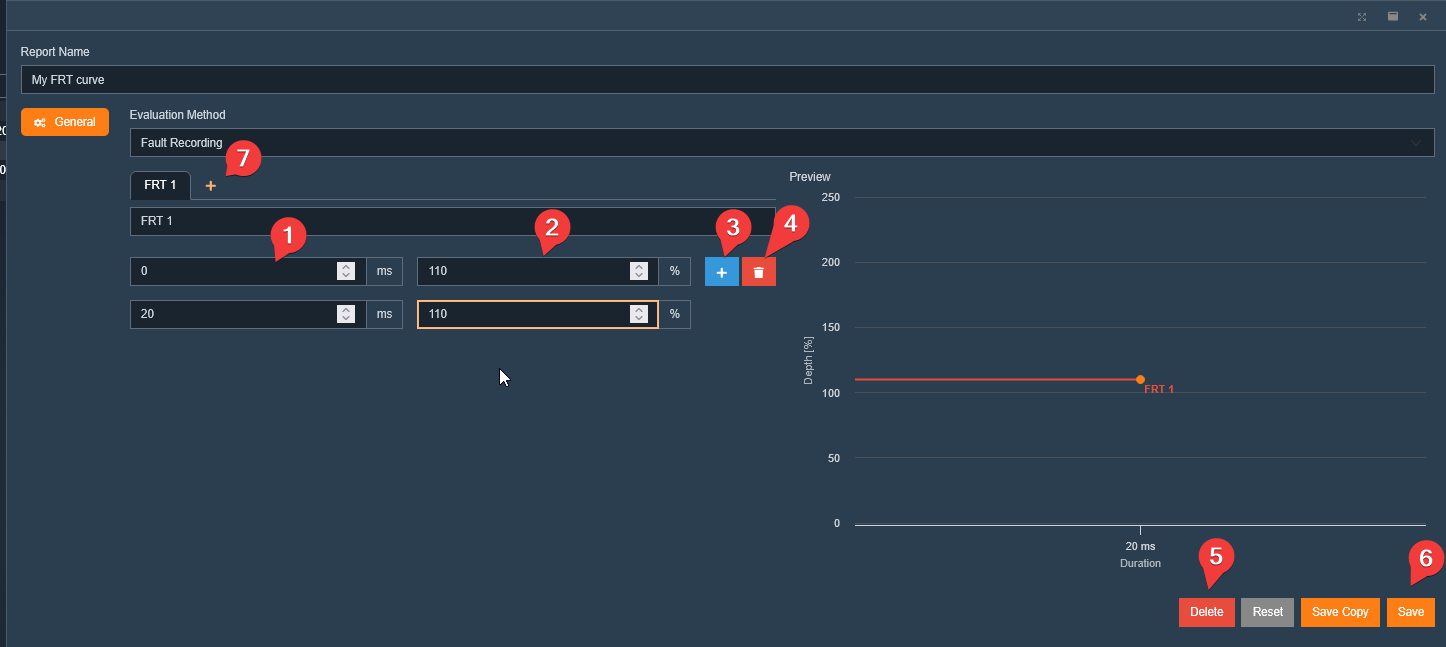
Select analysis type "FRT Curve" in the Analysis Cockpit under "Analysis Type"#1
Choose measurement points and analysis period #2 and #3
Select the created FRT curve from the template list #4
Click Apply to start analysis and plot events against the FRT curve #5
==> Events are displayed in the diagram, showing depth and duration of voltage dips
Click an event to open the associated disturbance record for detailed analysis #6
Save the analysis in the Dashboard for later access #7
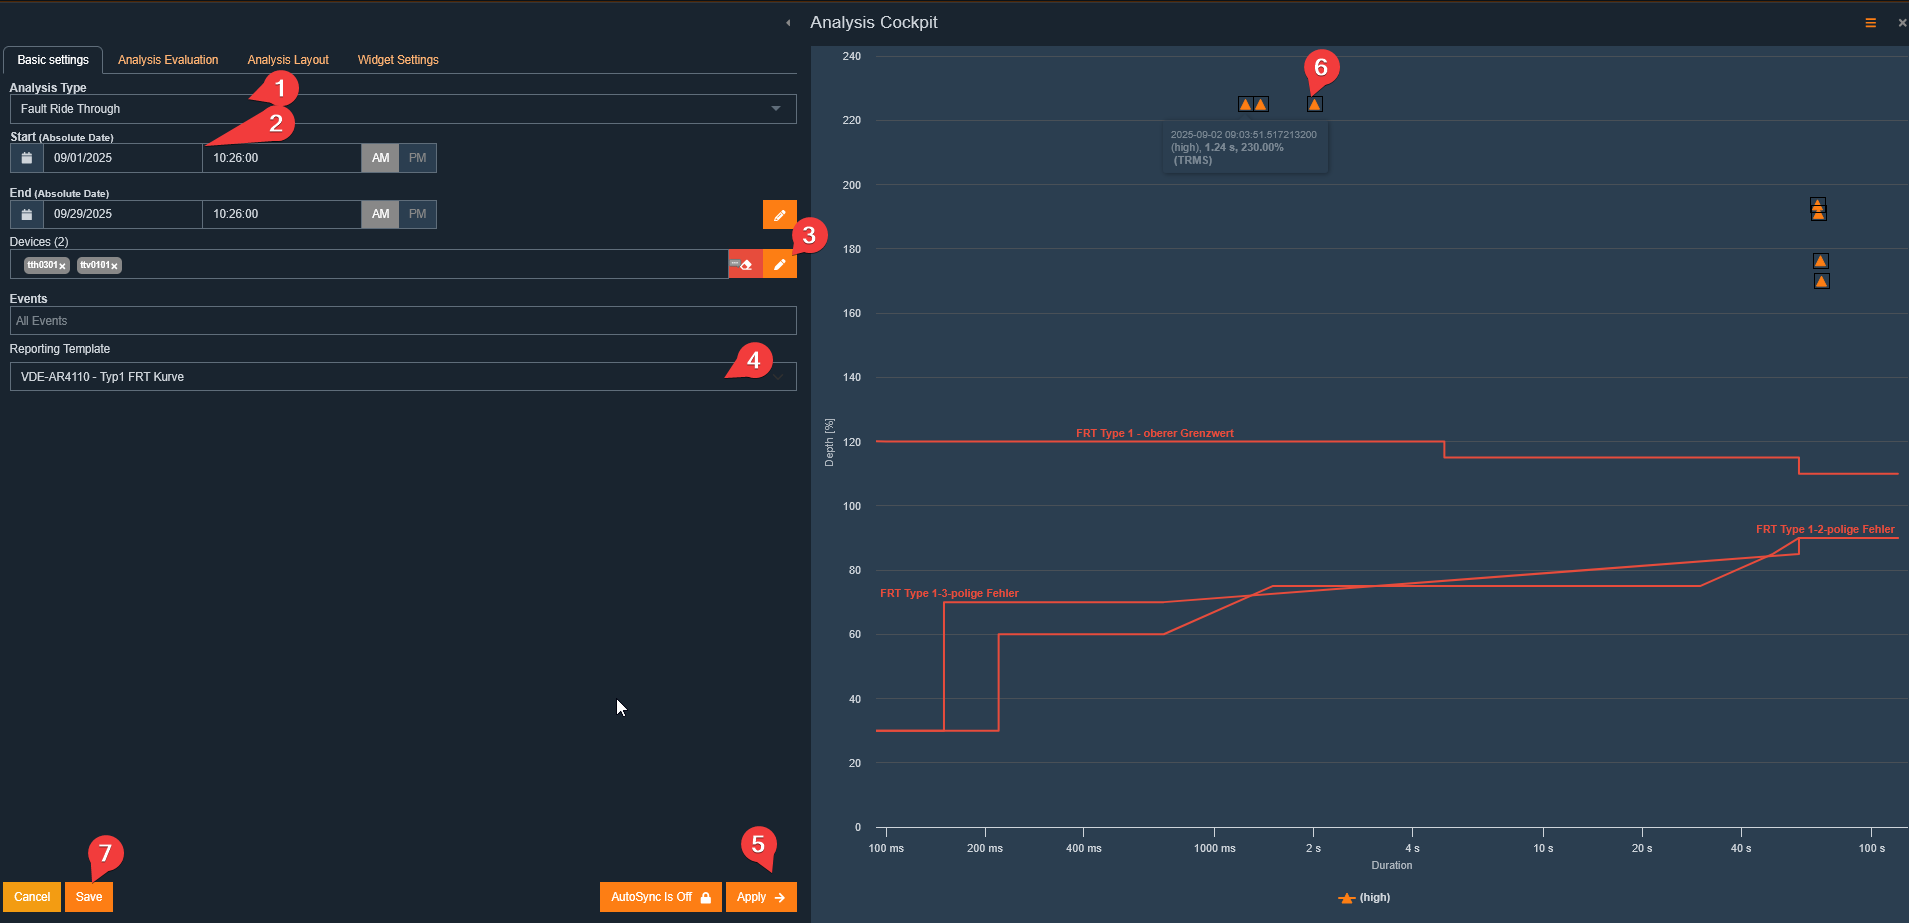
The PQ event matrix is based on EN50160 and correctly assigns power quality events according to the standard by depth and duration.
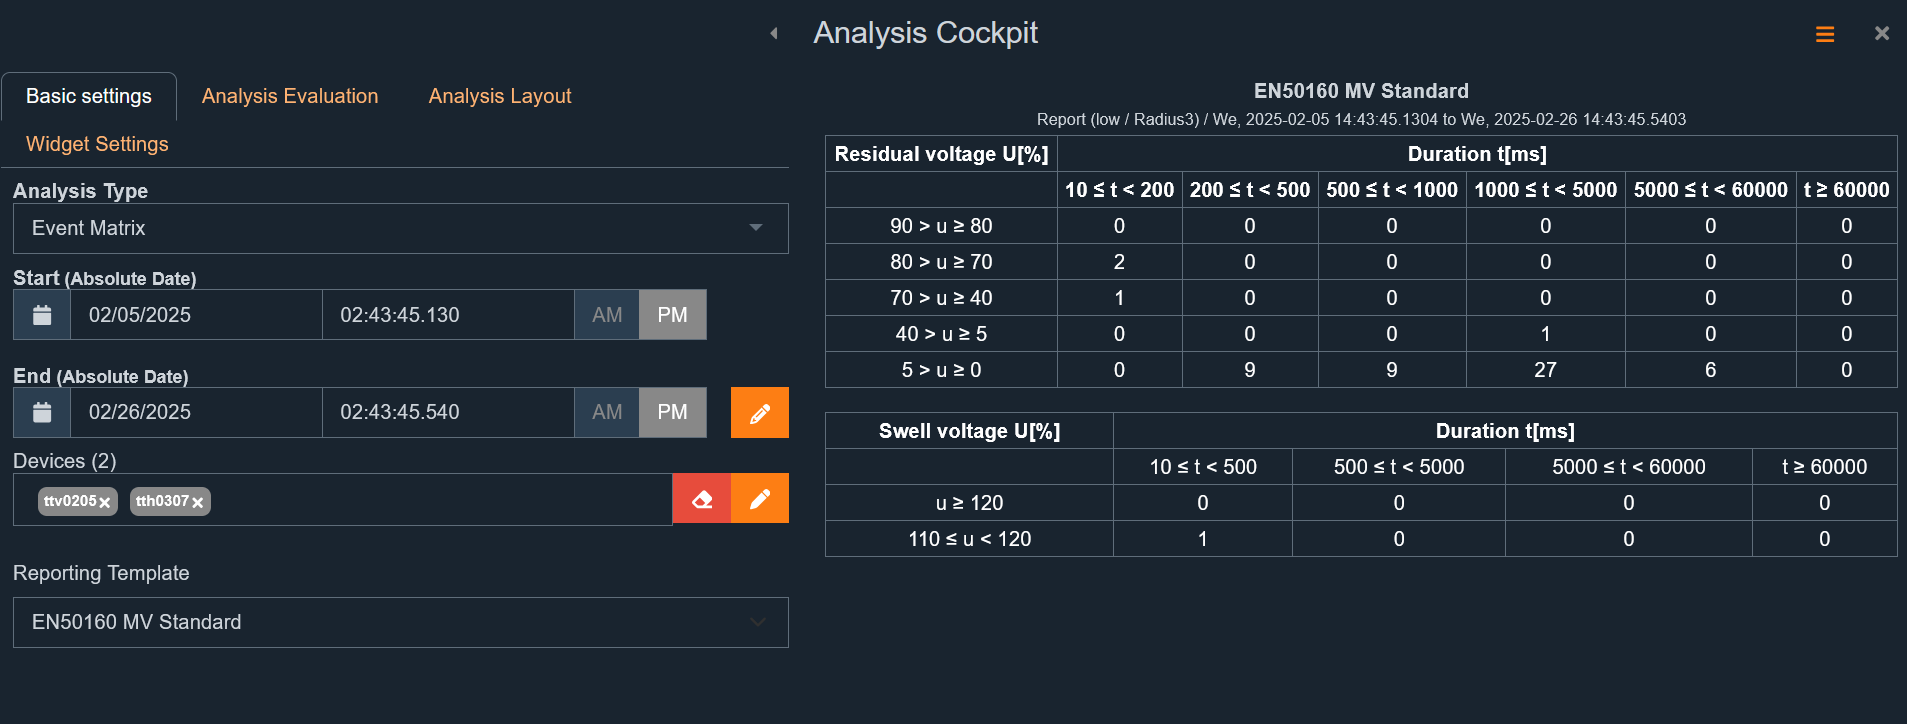
For medium and high voltage devices, only line-to-line PQ events (dips and swells) are considered.
For low voltage measurements, phase-to-earth PQ events are used.
According to IEC61000-4-30, these are always network events with a certain depth and duration.
Depending on the regional standard, different tabular display forms exist:
In South Africa, NRS048 applies.
In the Netherlands, Netcode is used.
The correct assignment and display can be selected via the standard template. Only the correct template needs to be selected.
The analysis period can be freely chosen.
The analysis can be applied to one or more measuring points.
Example: Netcode
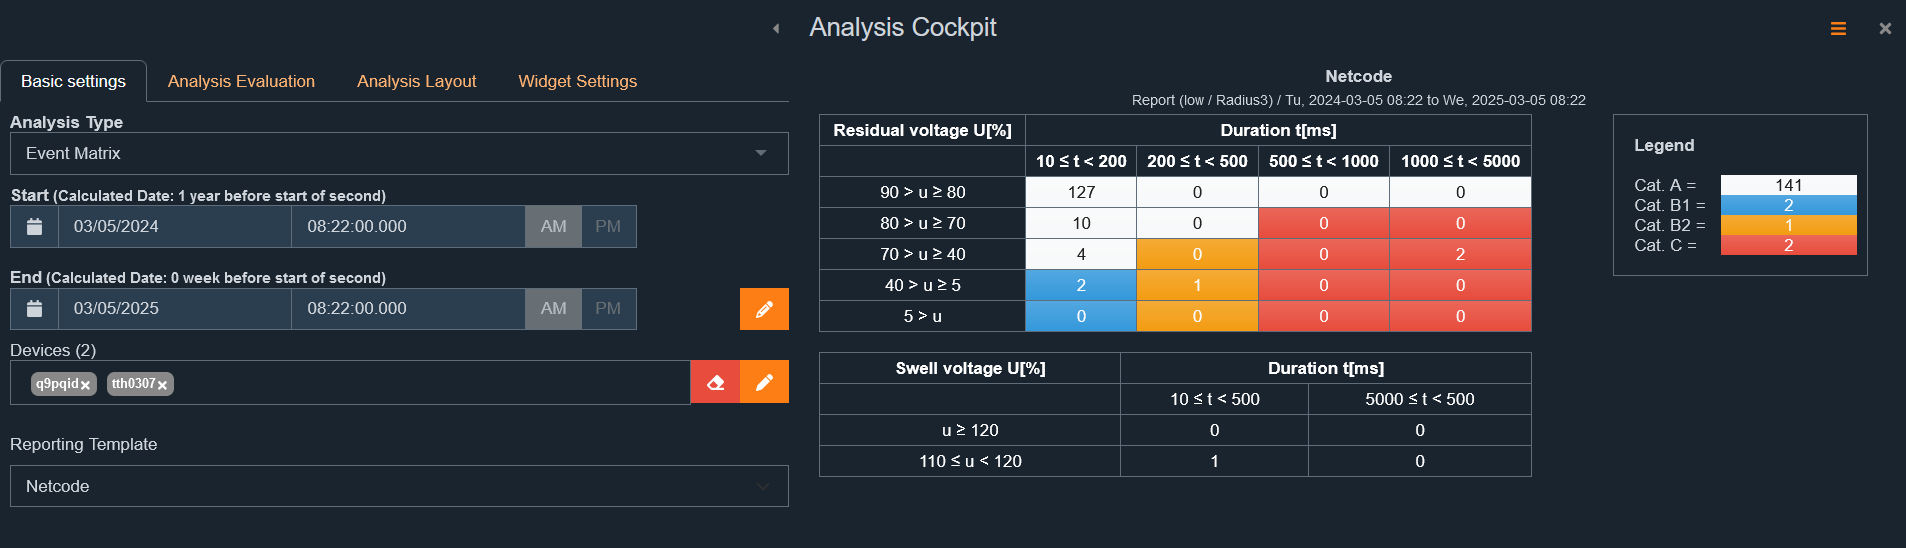
Example: NRS048
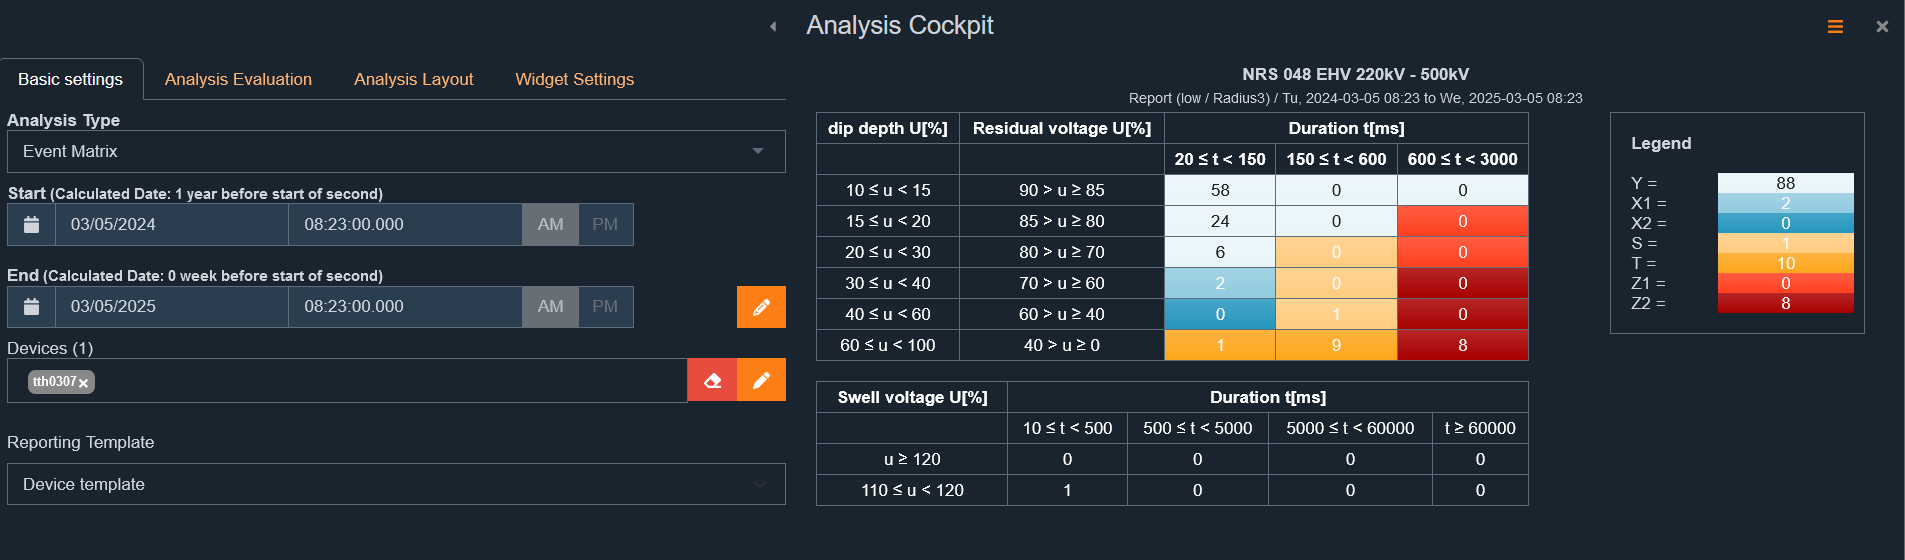
All directly connected device classes of types PQI-DA smart, PQI-DE or PQI-LV are live retrievable via direct data connection using TCP/IP streaming.
Measurement value display can be done in various analysis forms with a good data connection.
Important notes
⚠ High data consumption: Displaying live values generates very high data transfer!
⚠ Prioritisation of live data:
Live values have lower priority than continuous readout of disturbance records and long-term data.
This can cause delays in display.
Live values do not replace SCADA protocols such as IEC60870-5-104 or IEC61850, which offer real-time capability.
The oscilloscope image is fully downloaded from the device and displayed in regular quasi-stationary states.
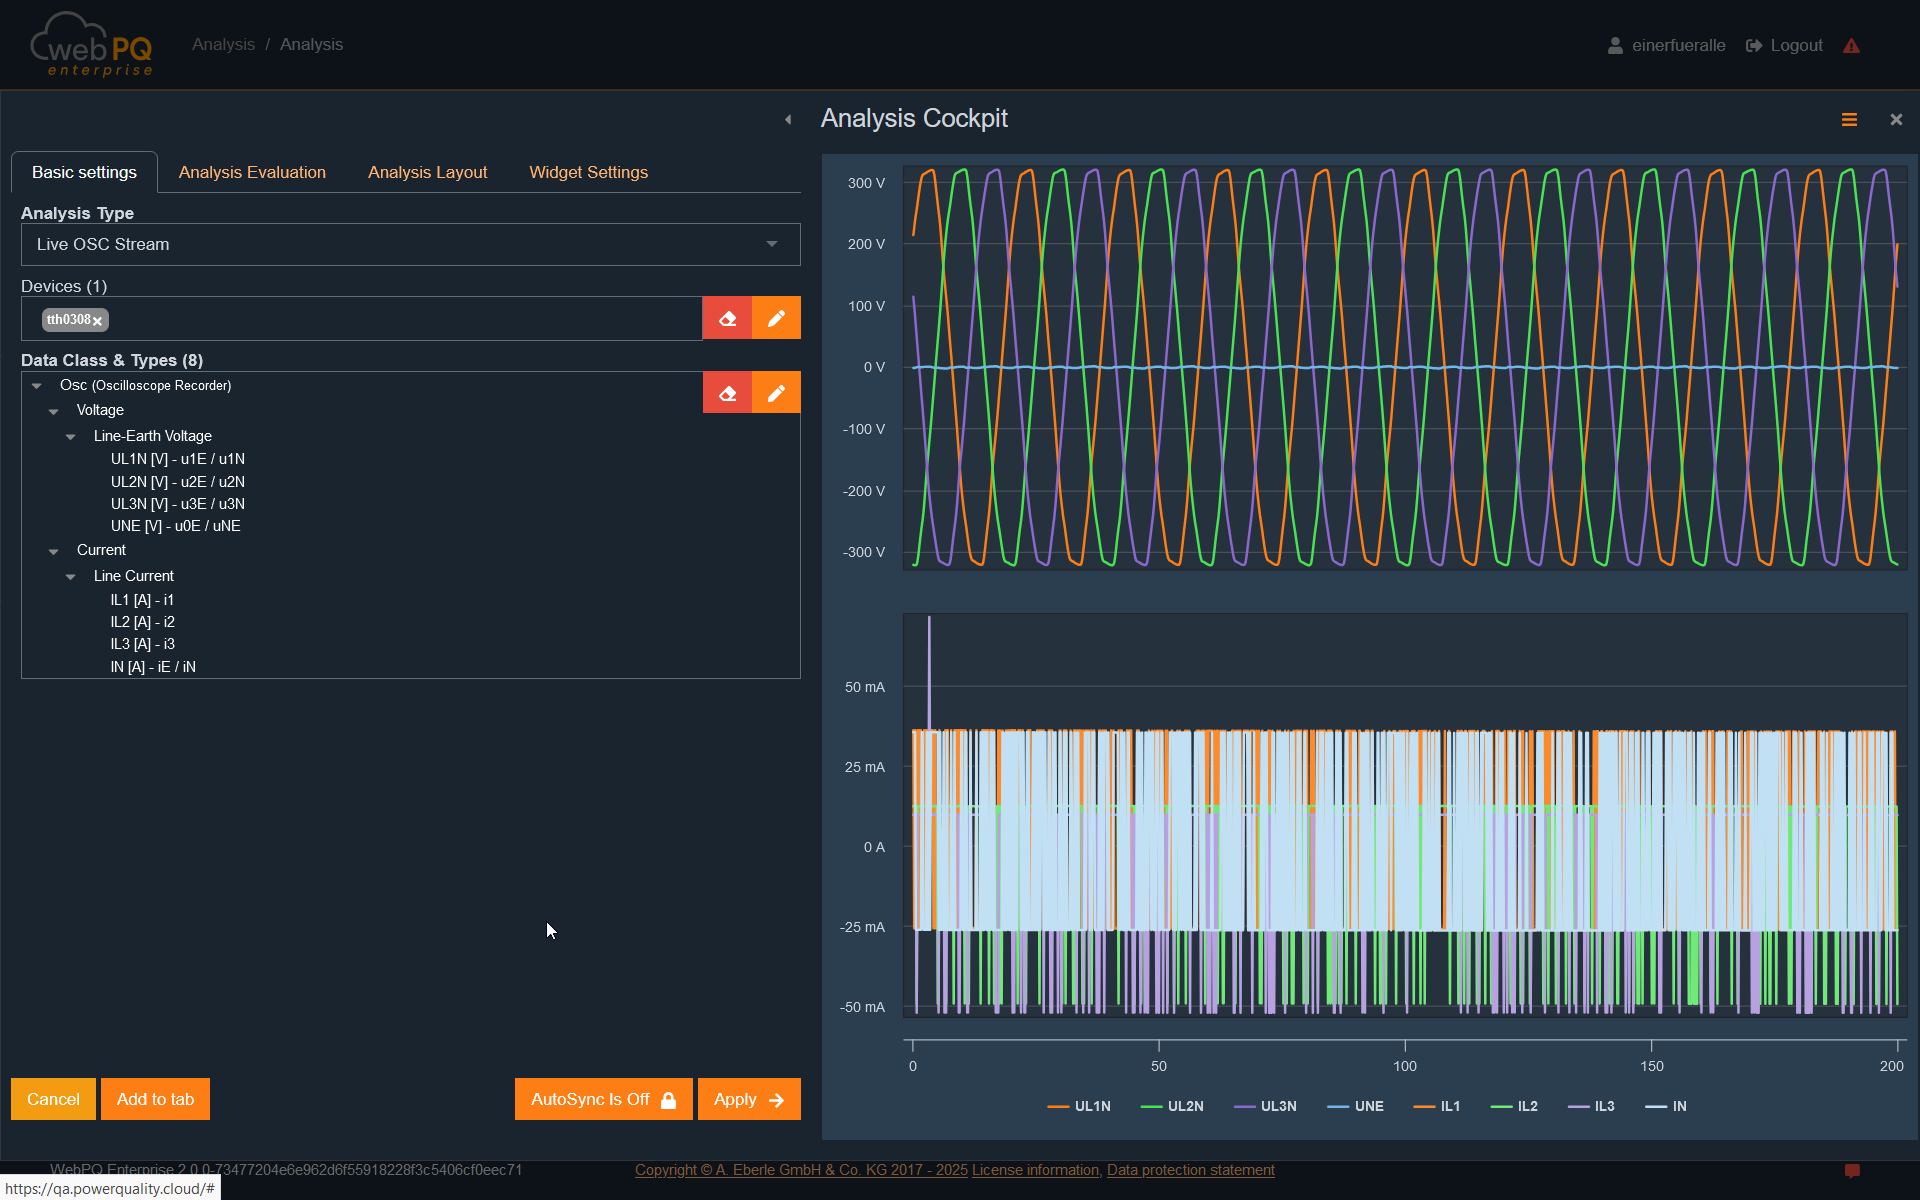
This analysis type is ideal for parallel comparison of multiple measuring points.
Any number of measuring points can be displayed with power in 1s measurement values or other data classes.
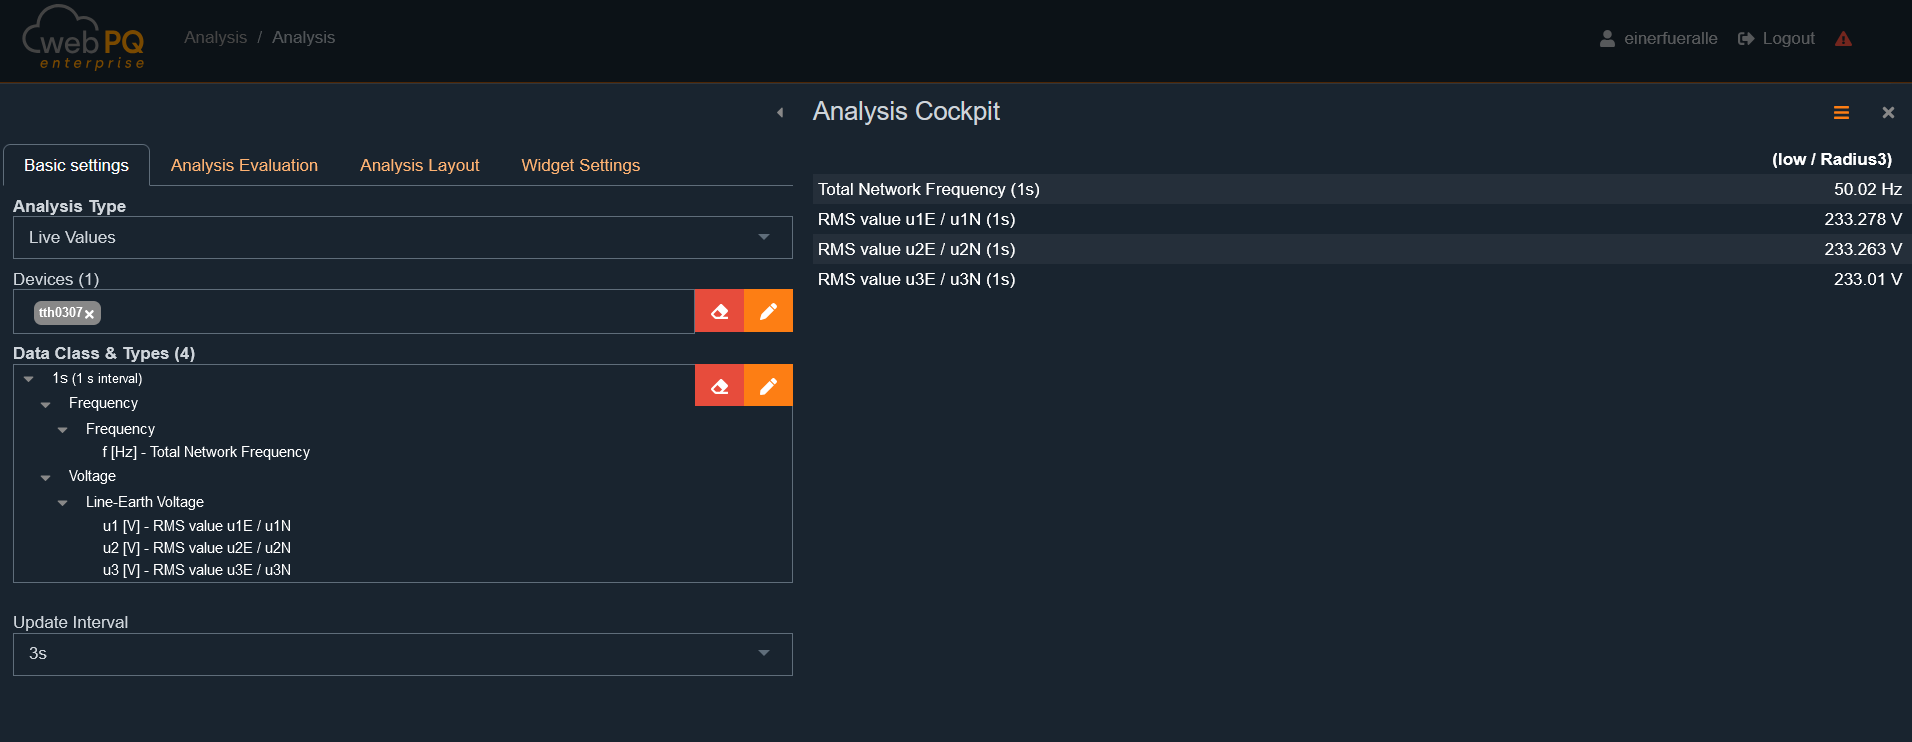
This analysis type is well suited to quickly visualise reactions at measuring points to switching actions or direct influences.
All measurement values available in streaming can be displayed live from multiple measuring points in parallel.
The maximum time frame determines how long data is retained in the display.
This analysis type shows all harmonics relative to the fundamental wave live.
Blue bar: Maximum value since streaming started
Red bar: Current value
Clicking a harmonic switches to the live time series of that harmonic.
The same settings as in historical harmonics analysis are possible:
Switch between current and voltage display
Various display types such as relative to the fundamental wave or absolute value can be selected.
This analysis type works identically to live harmonics analysis:
Blue bar: Maximum value since streaming started
Red bar: Current value
Clicking a harmonic leads to the live time series of that harmonic.
Switch between current and voltage as well as various display types.
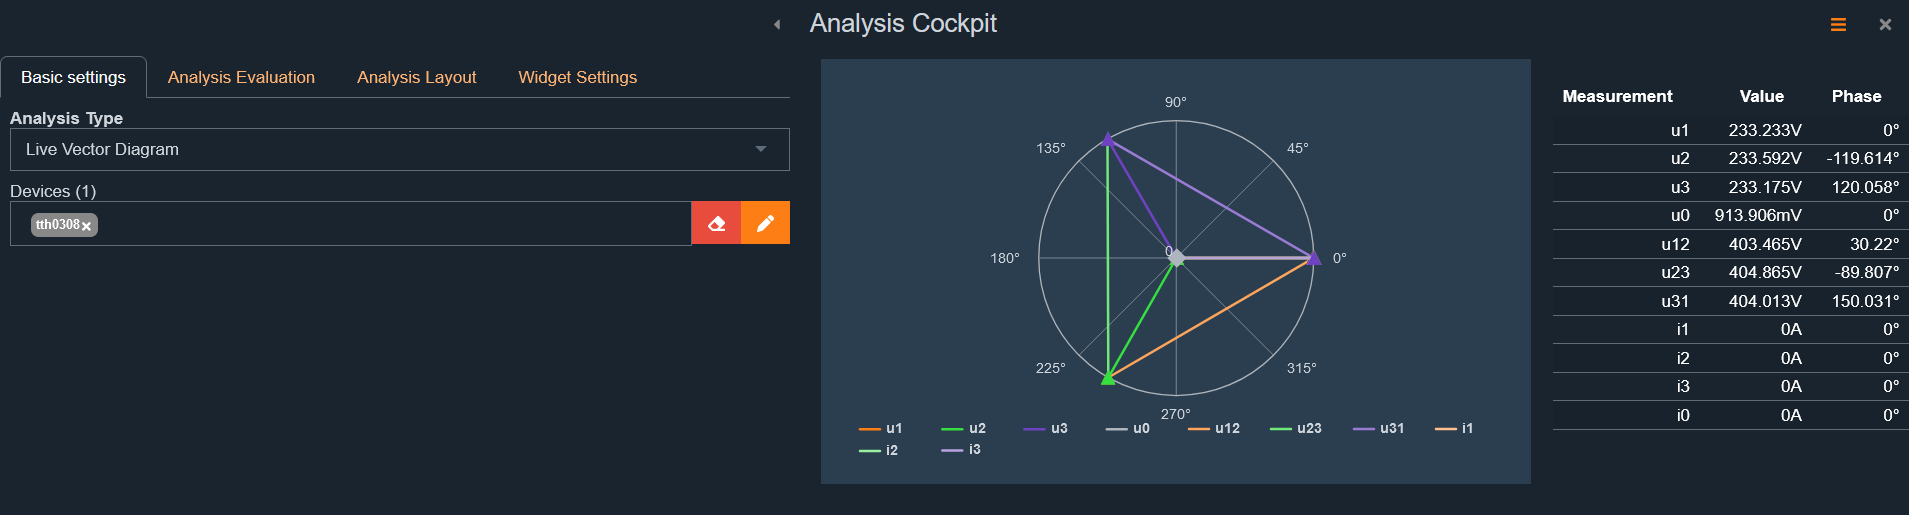
The vector diagram (phasor diagram) displays voltage and current phase angles in a three-phase system.
It is especially useful for checking device connections, as wiring errors or unsuitable consumer characteristics can be detected.
What does the vector diagram show?
Voltages and currents are displayed as vectors (phasors).
Each vector shows the amplitude (arrow length) and phase angle (arrow angle) of an electrical quantity.
Vectors are displayed for phase-to-phase (L-L) and phase-to-neutral (L-N).
How to interpret the vector diagram?
1. Phase shift between voltage and current
The phase angle between voltage and current indicates the load type:
Inductive load (e.g., motor, transformer)
Current lags behind voltage.
Typical for inductive consumers like motors or transformers.
Vector diagram: Current vector lags behind voltage vector.
Capacitive load (e.g., capacitor banks, long cables)
Current leads voltage.
Typical for capacitive consumers like capacitor banks for reactive power compensation.
Vector diagram: Current vector leads voltage vector.
Resistive load (e.g., heating resistors)
Current is in phase with voltage.
Typical for heating devices or incandescent lamps.
Vector diagram: Current and voltage vectors point in the same direction.
2. Detect wiring or connection errors
Reversed phase sequence
If phases are connected incorrectly, vectors appear in an unusual arrangement.
This can cause problems, e.g., motor rotation direction errors.
Missing or incorrect neutral conductor
An incorrect or missing neutral can cause asymmetries in voltages and currents.
Application areas of the live vector diagram
Check phase angle of voltages and currents
Identify load types (inductive, capacitive, resistive)
Diagnose wiring errors or rotation direction problems
Check network quality and asymmetries
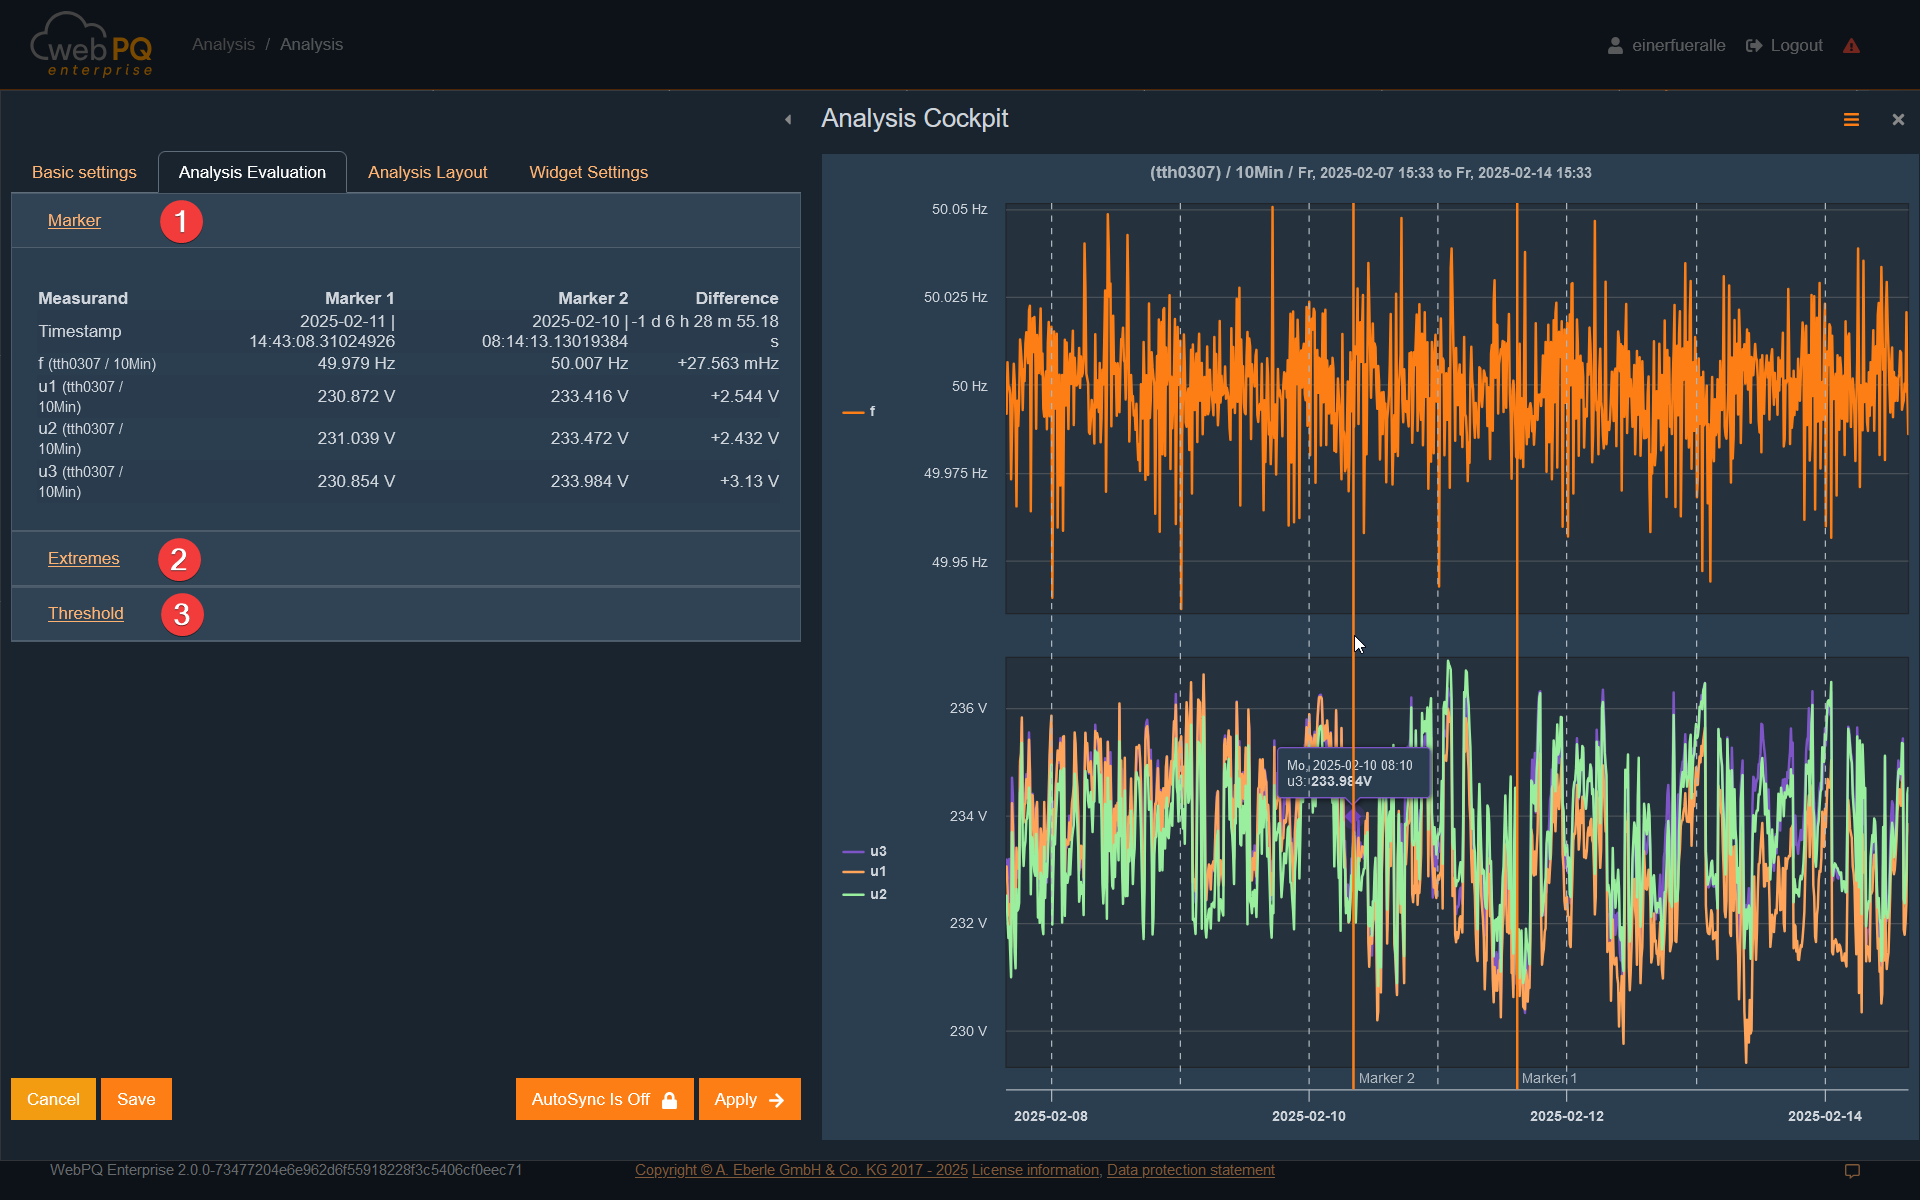
Analysis evaluation offers various options for detailed examination of analysed measurement values.
#1)Markers can be set in various analysis types.
Markers allow targeted examination of individual measurement points.
In analysis evaluation, marker values are clearly displayed.
#2)Extreme values of the selected measurement series are displayed:
Minimum values
Maximum values
Average values
This helps to quickly identify key measurement deviations.
#3)Limit values stored in measuring devices can be viewed.
This allows a quick check if values are within permissible limits.
For disturbance records, trigger conditions are displayed here.
Analyse voltage fluctuations and deviations in real-time.
Identify critical values for quick fault diagnosis.
Compare measured values with standard specifications stored in the system.
In "Analysis Layout", grouping methods #1, scaling #2, and colours #3 of measurement values can be defined.
Using "Group by", measurement values can be displayed individually:
Each value is shown in a separate level-time diagram.
Group by device and data type (unit).
Group across multiple devices by data type in different diagrams.
Using "Settings for device names"#4, device names can be set via tags and categories in analyses.
In the screenshot, an example of a local network station with feeder display. Feeder names are assigned to a device via category "device"#5.
Feeders are displayed and labelled in the diagram via "assigned slave name"#6.
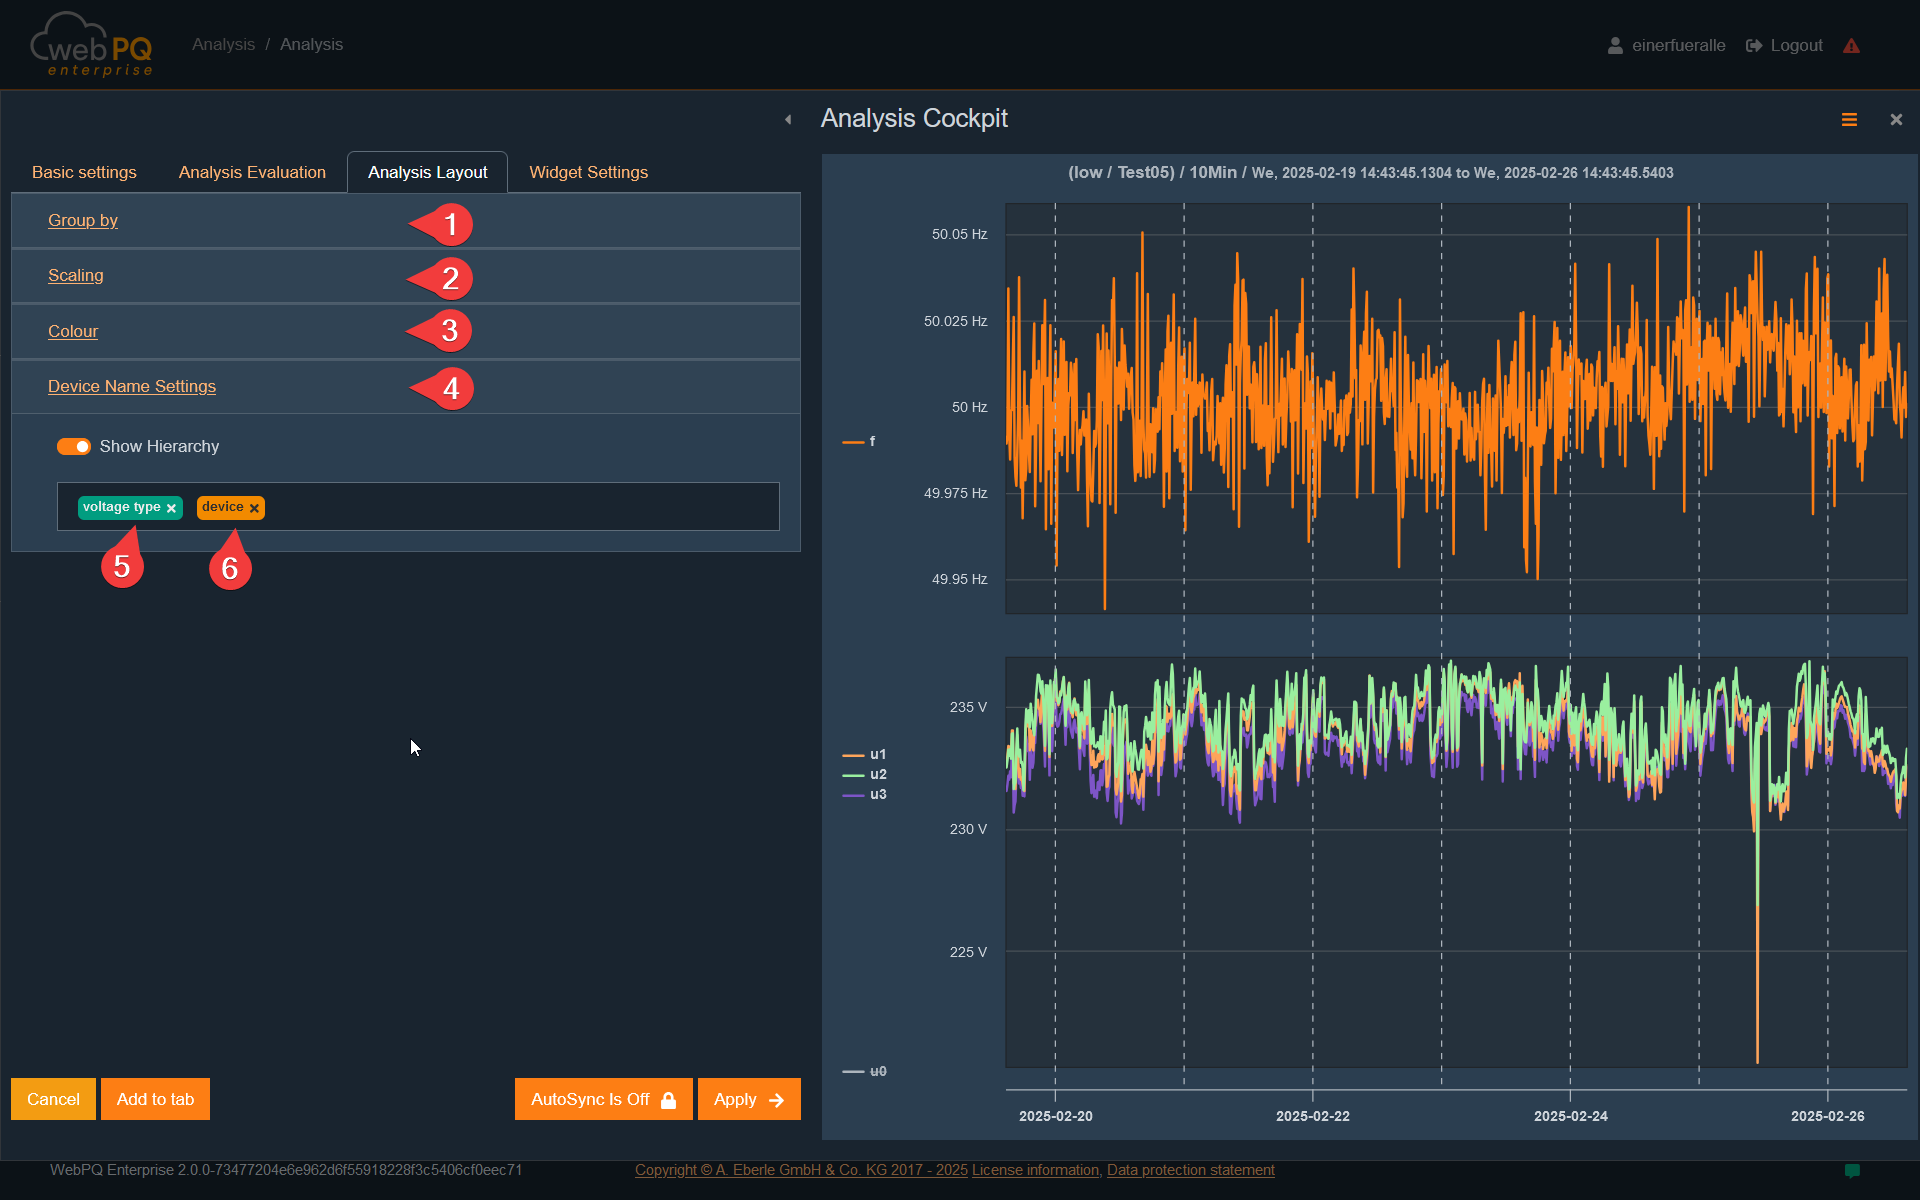
Under "Widget settings", you can adjust the title and size of the widget.
These settings are relevant when the analysis is transferred to the dashboard and saved permanently.
This view offers detailed and pre-configured analysis functions for individual measuring devices to specifically access their data.
The view is divided into three areas:
Power Quality Report#1
Historical Data#2
Live Data#3
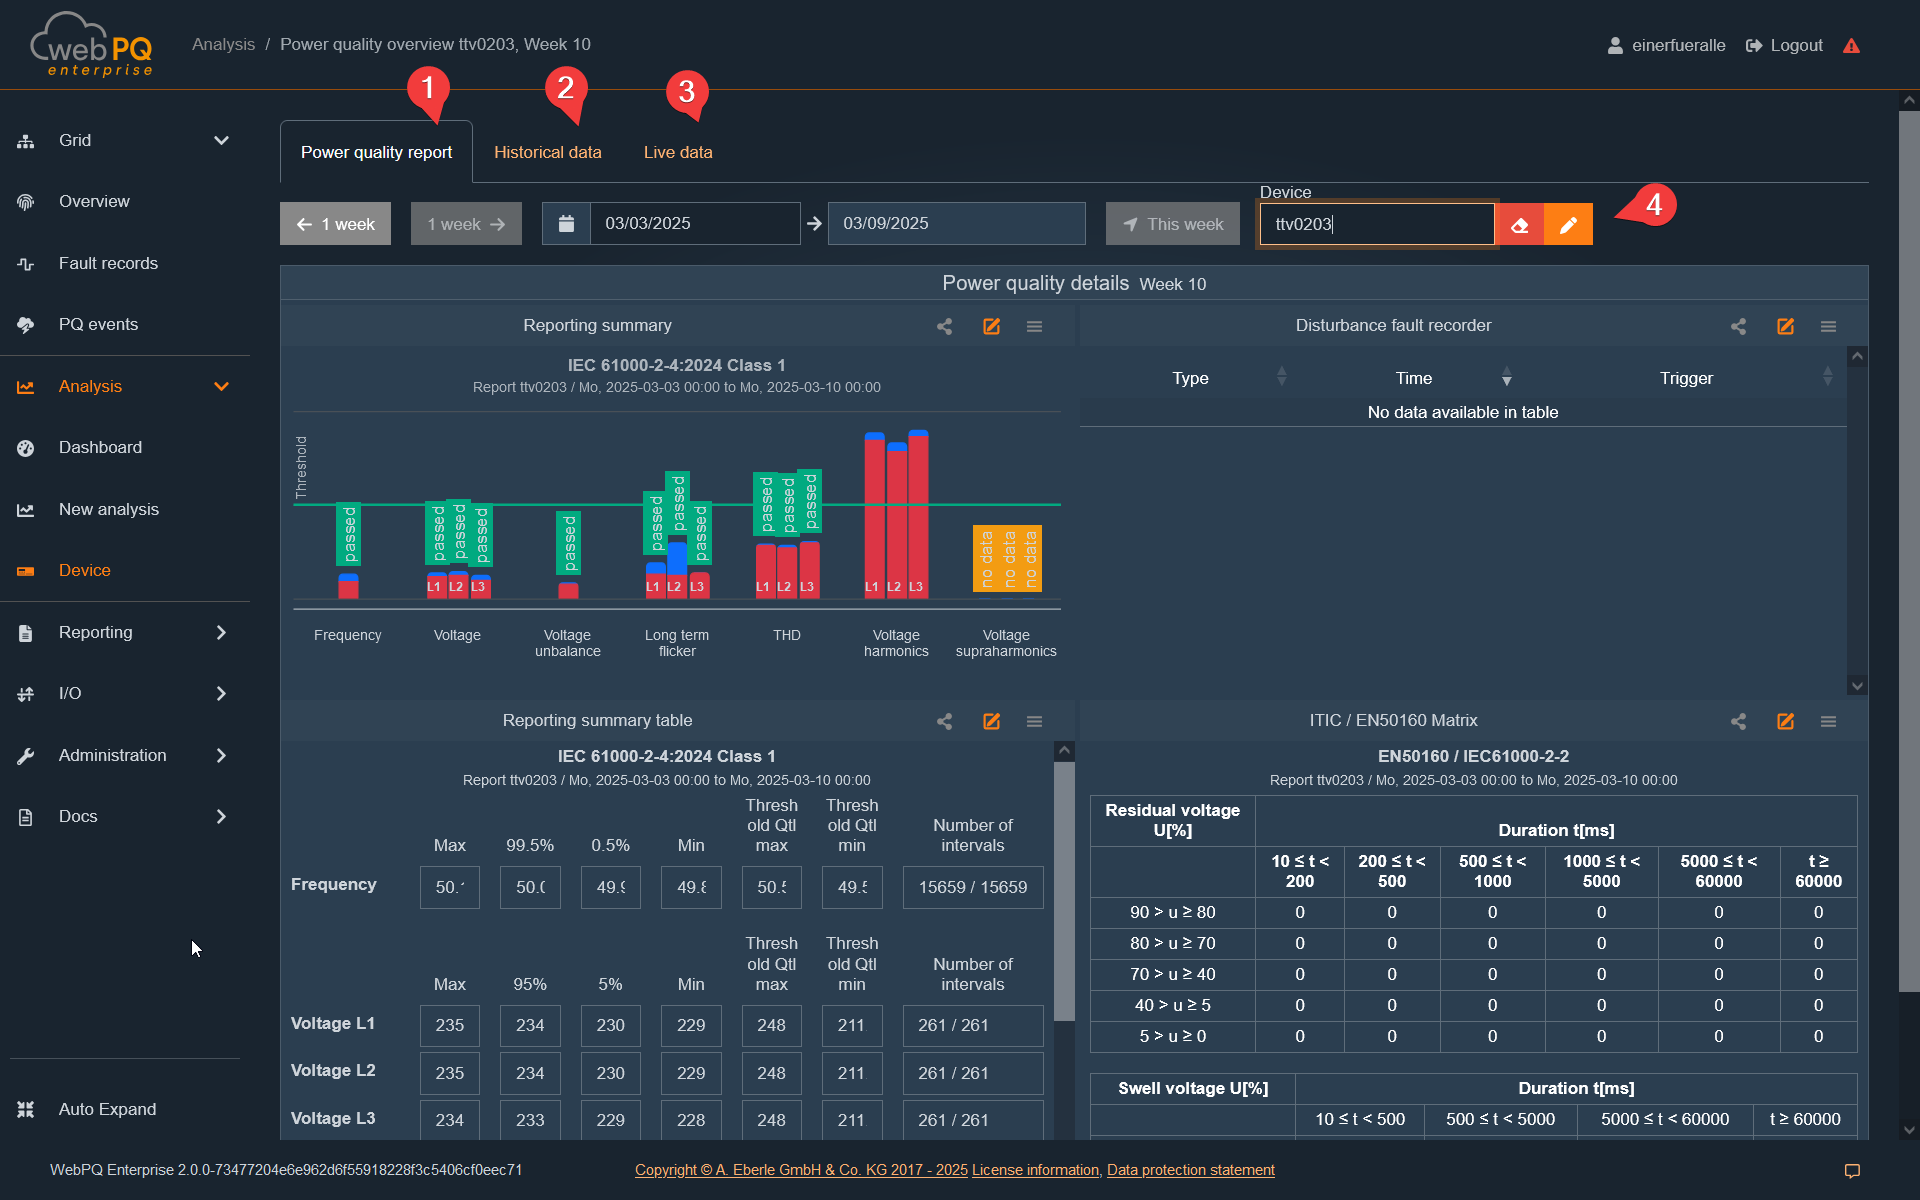
As a user, you have the option to switch the measuring device via #4 and switch between the data weekly.
The Power Quality Report consists of four types of analysis:
Summary of the necessary measured variables according to the set norm template in a clear bar chart based on the limit values.
Explanation of the EN50160-relevant measured variables.
List of disturbances recorded by the measuring device.
List of PQ events in the EN50160 matrix.
By clicking on the bars, the drill-in procedure opens to display the measurement data in detail.
In the "Analyse Device"#2 tab, there are pre-configured level-time diagrams, histograms, and the ITIC curve.
In the Live Data#3 area, the user has the option to visualize the live data of the device if the selected measuring device is directly connected.
The Analysis Dashboard, which can be found in the navigation bar on the left side under "Analysis > Dashboard" #1, is used for the permanent storage of analyses in widgets that were created via the Analysis Cockpit. Using the Add analysis function #2, it is possible to open the Analysis Cockpit, define an individual analysis, and transfer it to the Analysis Dashboard.
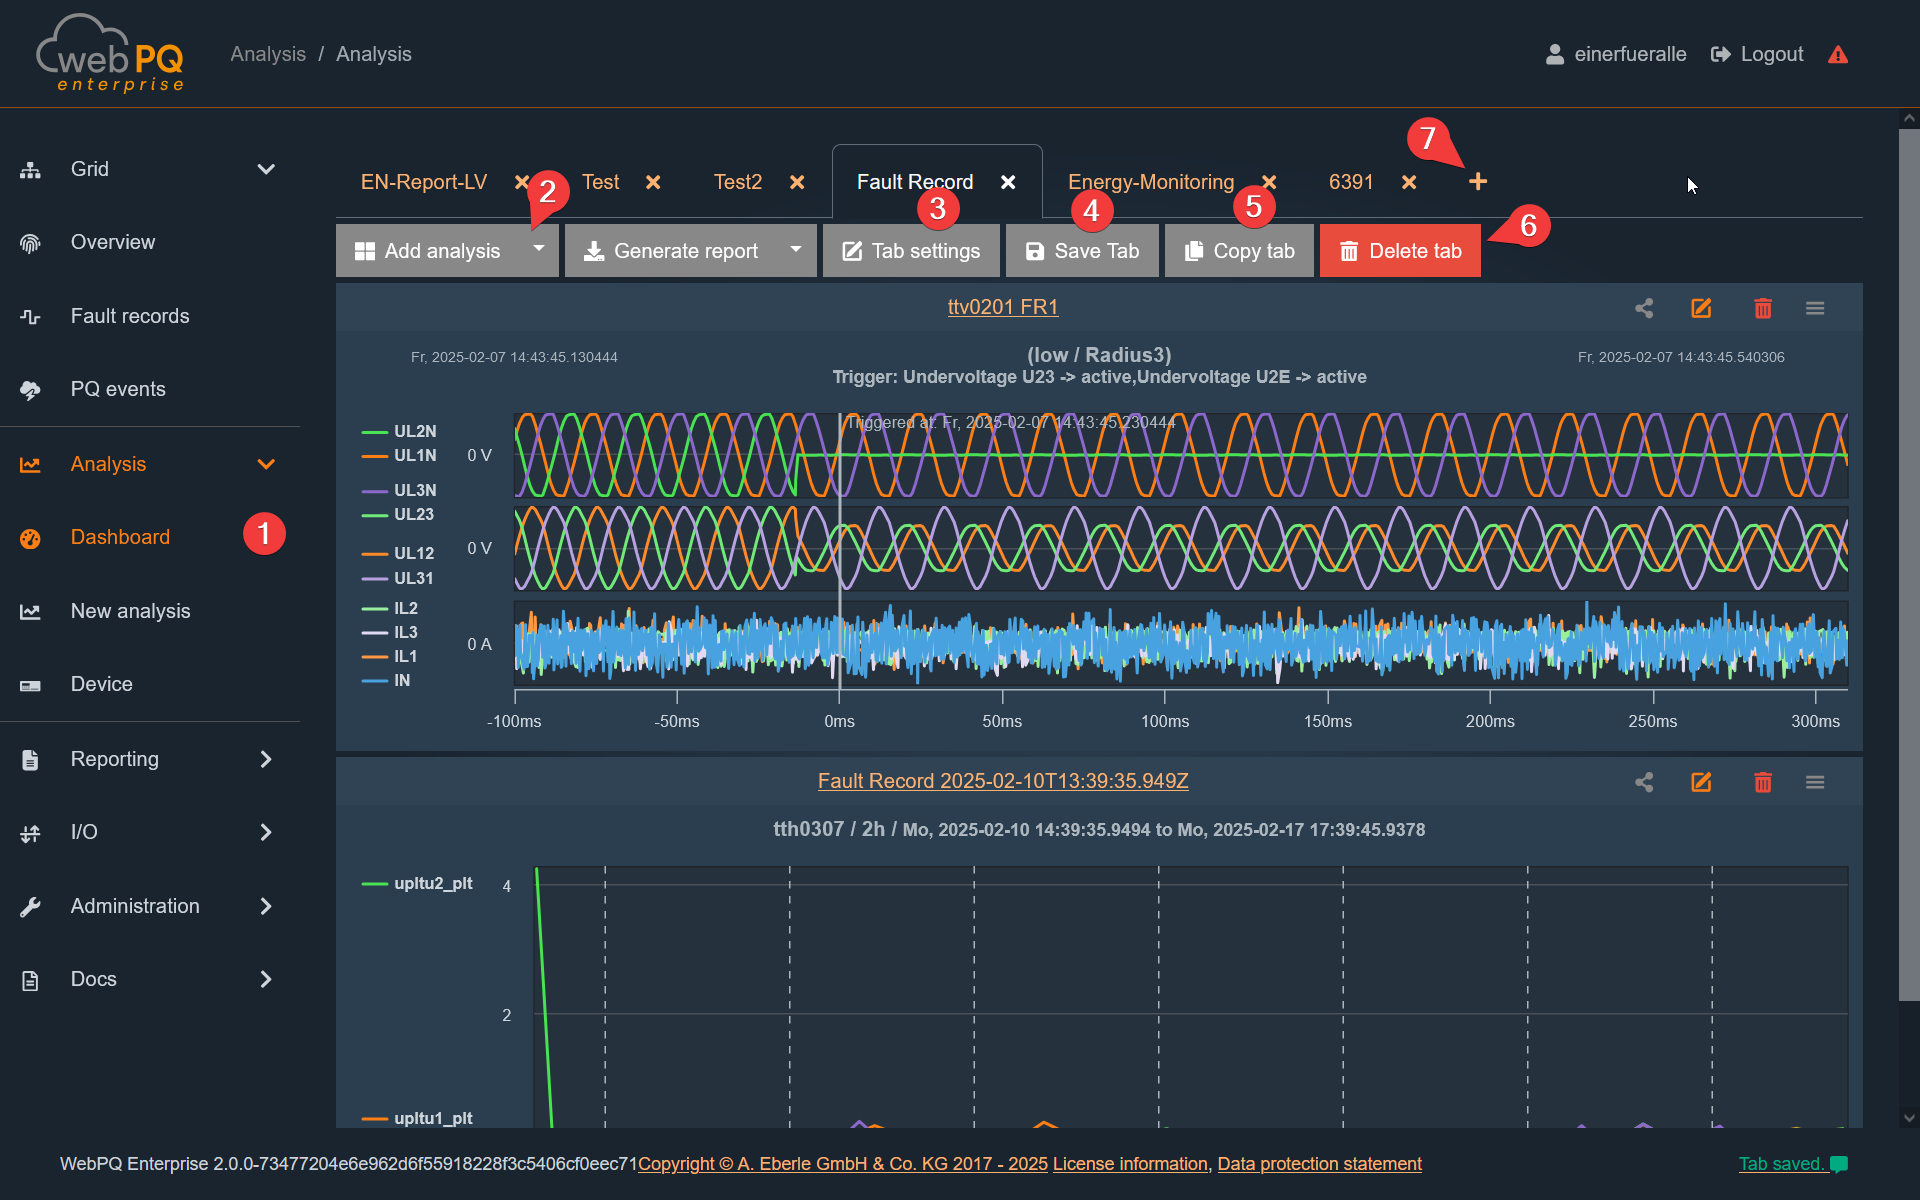
With the "Tab settings" function #3, the time period for all analyses stored in the tab can be changed. For example, in one widget, you can select performance, and in another widget, you can select maximum currents, voltages, and THD (Total Harmonic Distortion). To compare the dependencies of the variables with each other weekly, the time period for all widgets can be adjusted via the Tab Settings. Click on "Tab Settings" and change the time range for the tab and all analyses contained within it.
The "Save Tab" function #4 saves settings such as window sizes, zoom levels, markers, etc. If changes have been made, the user will be prompted to save or discard the changes when leaving the Analysis Dashboard. Unsaved tabs are marked with a "*", making them easy to find again to complete the saving process.
With the #5 function, tabs can be duplicated and saved under a new name. The #6 function deletes the tab directly. However, if a tab is closed via the X next to the tab name, it is not deleted but can be displayed again at any time via the tab menu #7 in the tab bar.
The Tab Menu opens the tab menu. In the "Load Saved Tabs" area, all tabs can be transferred back to the interface from the background storage. To create a new tab, click on "+ Create New". To save the tab copied using function #5 into a new one, use the "Add Tab" function and paste the content into the empty field using CTRL+V.
Copied dashboard content can be reused in two ways:
To create a new dashboard tab, open the tab menu, choose "+ Create New", and paste the copied JSON into the field. WebPQ accepts JSON copied from a complete tab. If JSON copied from a single analysis is pasted here, WebPQ creates a new tab that contains only that analysis.
To add analyses to the current tab, use Paste Analysis and paste JSON copied from an analysis or from a complete tab. When the JSON contains a tab, WebPQ shows the analyses from that tab in a list. Select the analyses that should be imported and confirm the dialog.
The import preview shows the analysis type, devices, and interval for each analysis. If the copied source tab used tab-wide time settings, WebPQ keeps that source interval for the imported analyses so the content matches the original tab. If the pasted content is not valid JSON or cannot be read as an analysis or tab, the dialog shows the problem directly before anything is imported.
In addition to personal dashboard tabs, WebPQ also supports shared Group Dashboards. The page is available in the left navigation under Analysis > Group Dashboards and shows the dashboard tabs of all groups the current user belongs to.
Create a Group Dashboard
Group dashboards are created by transferring an already saved personal dashboard tab:
Open Analysis > Dashboard.
Save the tab first. Unsaved tabs cannot be transferred.
Click Transfer to Group Dashboards in the tab toolbar.
Select the target group.
Confirm the transfer.
After a successful transfer, the tab is removed from the personal dashboard and becomes a shared group dashboard tab.
Open and find Group Dashboard tabs
The Analysis > Group Dashboards page loads all tabs that are visible to the current user through group membership.
The tab title includes the group name, which helps distinguish tabs with the same business purpose in different groups.
If many shared tabs exist, the page shows additional discovery controls with a Group filter and a Search field.
Search matches the group name and the tab title.
Edit shared tabs
Once a shared tab is opened, it behaves like a normal analysis dashboard tab:
analyses can be added or adjusted,
tab-wide settings can be changed,
the current state must be saved explicitly,
and deleting the tab removes the shared group tab.
This makes group dashboards suitable for shared team views that should stay identical for all members of the same group.
Conflicts while saving
If another user saves the same group dashboard tab before your changes are stored, WebPQ detects the version conflict and offers three options:
Reload latest discards the local state and loads the newest saved version.
Keep local copy keeps your current local changes open so you can review them against the latest saved version.
Overwrite saves your current local state immediately as the new shared version.
The dialog also shows which user last edited the tab and when the latest change was saved.
Notes
The transfer action is only available for users who are members of at least one group in the current tenant.
Group dashboards are intended for collaborative reuse. Personal scratch tabs should remain in Analysis > Dashboard until they are ready to be shared.
The time setting#1 in the analysis allows the user to open a dialog window for configuring the analysis period and to define extensive time options relevant for the analysis of equidistant measurement values.
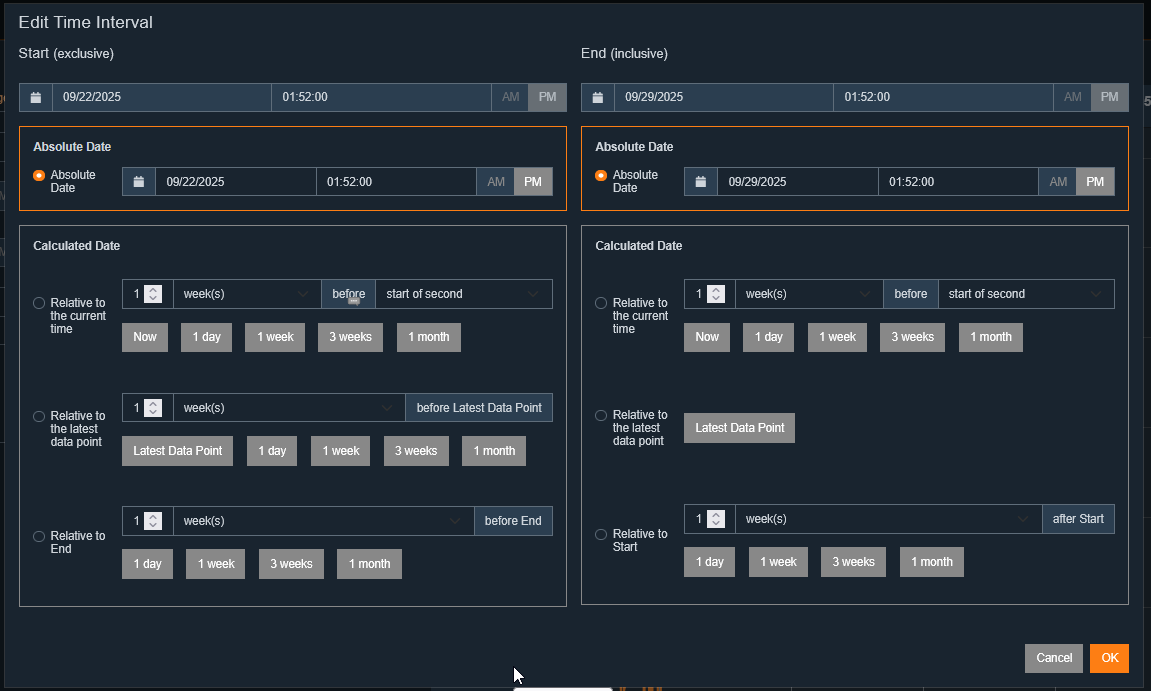
In general, four different modes are available:
Absolute period:
In this mode, the user can specify a fixed start and end time for the analysis. This is especially useful when a clearly defined time range needs to be examined, such as analyzing measurement data within a specific project or event. Selection is made via a calendar and time dialog, allowing precise input. This enables targeted analysis and comparison of data from the desired time window.
Relative period to current time:
Here, the user can define a period that dynamically relates to the current time, such as “the last 24 hours” or “the last 7 days.” This mode is particularly practical for ongoing analysis of current events and is ideal for dashboards that should always display the latest data. Using the software’s automation feature, the analysis can be configured to automatically evaluate and report on the current period. This enables dynamic and continuous reporting without manual adjustment of the time range.
Relative period to last measurement value:
With this option, the user can set a period based on the last available measurement value. This is helpful when the analysis should always be based on the most recent data, regardless of when it was recorded. It is especially beneficial for measurement series that are not recorded continuously but at irregular intervals. For example, analyses can always be performed retrospectively from the last measurement value for a specified period.
Relative to end:
In this mode, the period is set relative to the end of the available data. This means the analysis focuses on the last segment of the measurement data, regardless of the current time or last measurement value. This is particularly useful for reviewing data history, such as identifying trends or changes in the last section of data. The user can flexibly determine how far back the analysis should reach, starting from the end of the data series.
In the menu under "Templates & Tasks >> Reporting Templates", templates for evaluating various power quality parameters are available. These templates are updated and expanded with each software update to stay current. Additionally, you can create your own templates and save them in the list or base them on an existing template.
Each template can be applied to one or more devices to generate reports with the corresponding threshold values. You can also work with threshold sets in analyses and use them as templates, or use threshold sets for event-based monitoring.
Using Templates in Analyses and Event-Based Monitoring
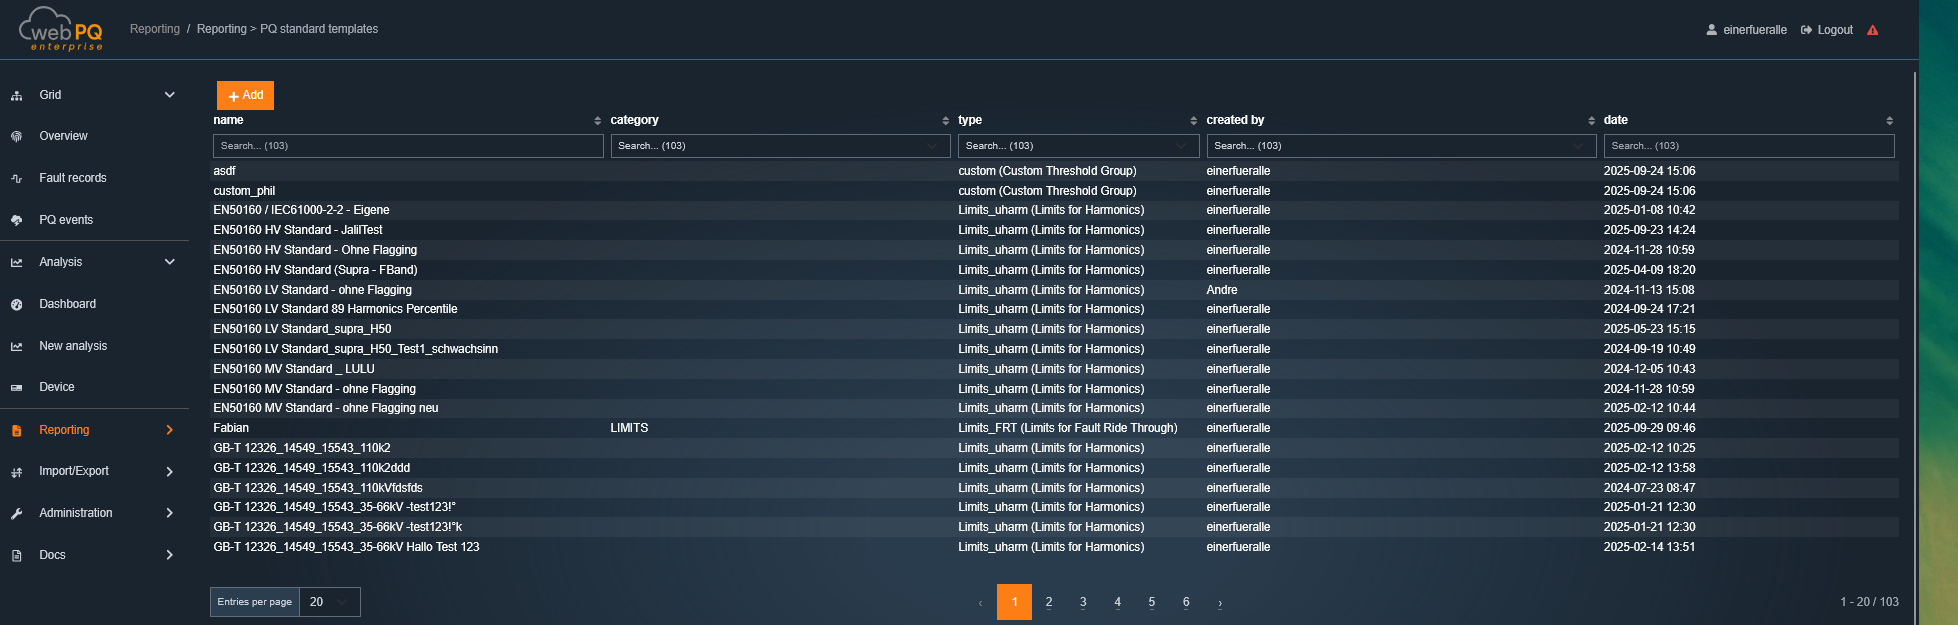
Currently, the following standards and threshold sets are supported:
Customer-specific thresholds – measurement monitoring
Power quality standards such as EN50160 for low, medium, and high voltage, or IEC61000-2-2
Fault Ride Through (FRT) curves – for evaluating feed-in systems
To view the thresholds of a template, simply click on the corresponding name of the standard or threshold template. A detail window will open with the relevant information.
Using the free text search, you can search for standards or categories such as countries or continents.
Standard templates can be applied directly to devices and individually adapted to customer-specific requirements.
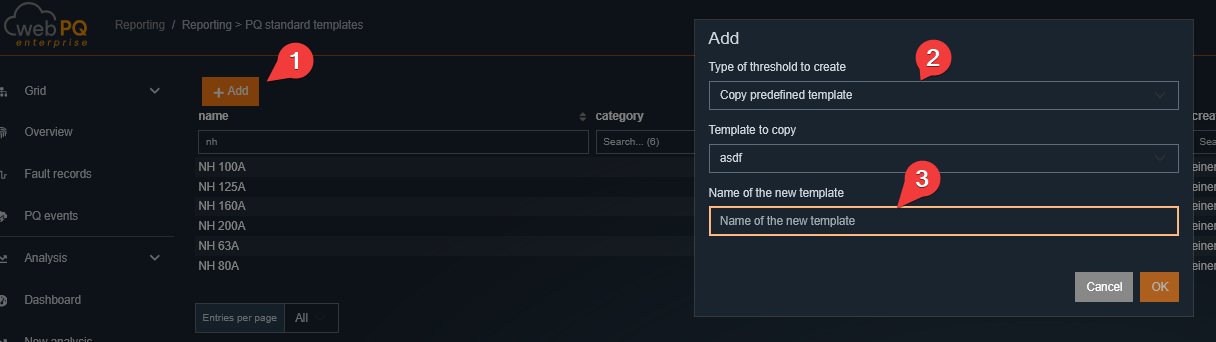
Clicking "+ Add" #1 opens a wizard for adding or configuring your own template.
You can select the following modes:
Copy: Select and copy an existing template
Customer-specific threshold / measurement monitoring: Create a completely new template for measurement monitoring or as a fully custom template. For example, you can create a threshold set for any parameter. Use cases include monitoring individual harmonics, current values, or other analog measurements such as maximum values for local substations and their fuse sizes in current or power.
FRT Curves: Create your own FRT curves, e.g., for evaluating feed-in systems.
After selecting the mode, you enter the template name and description in the next step #3.
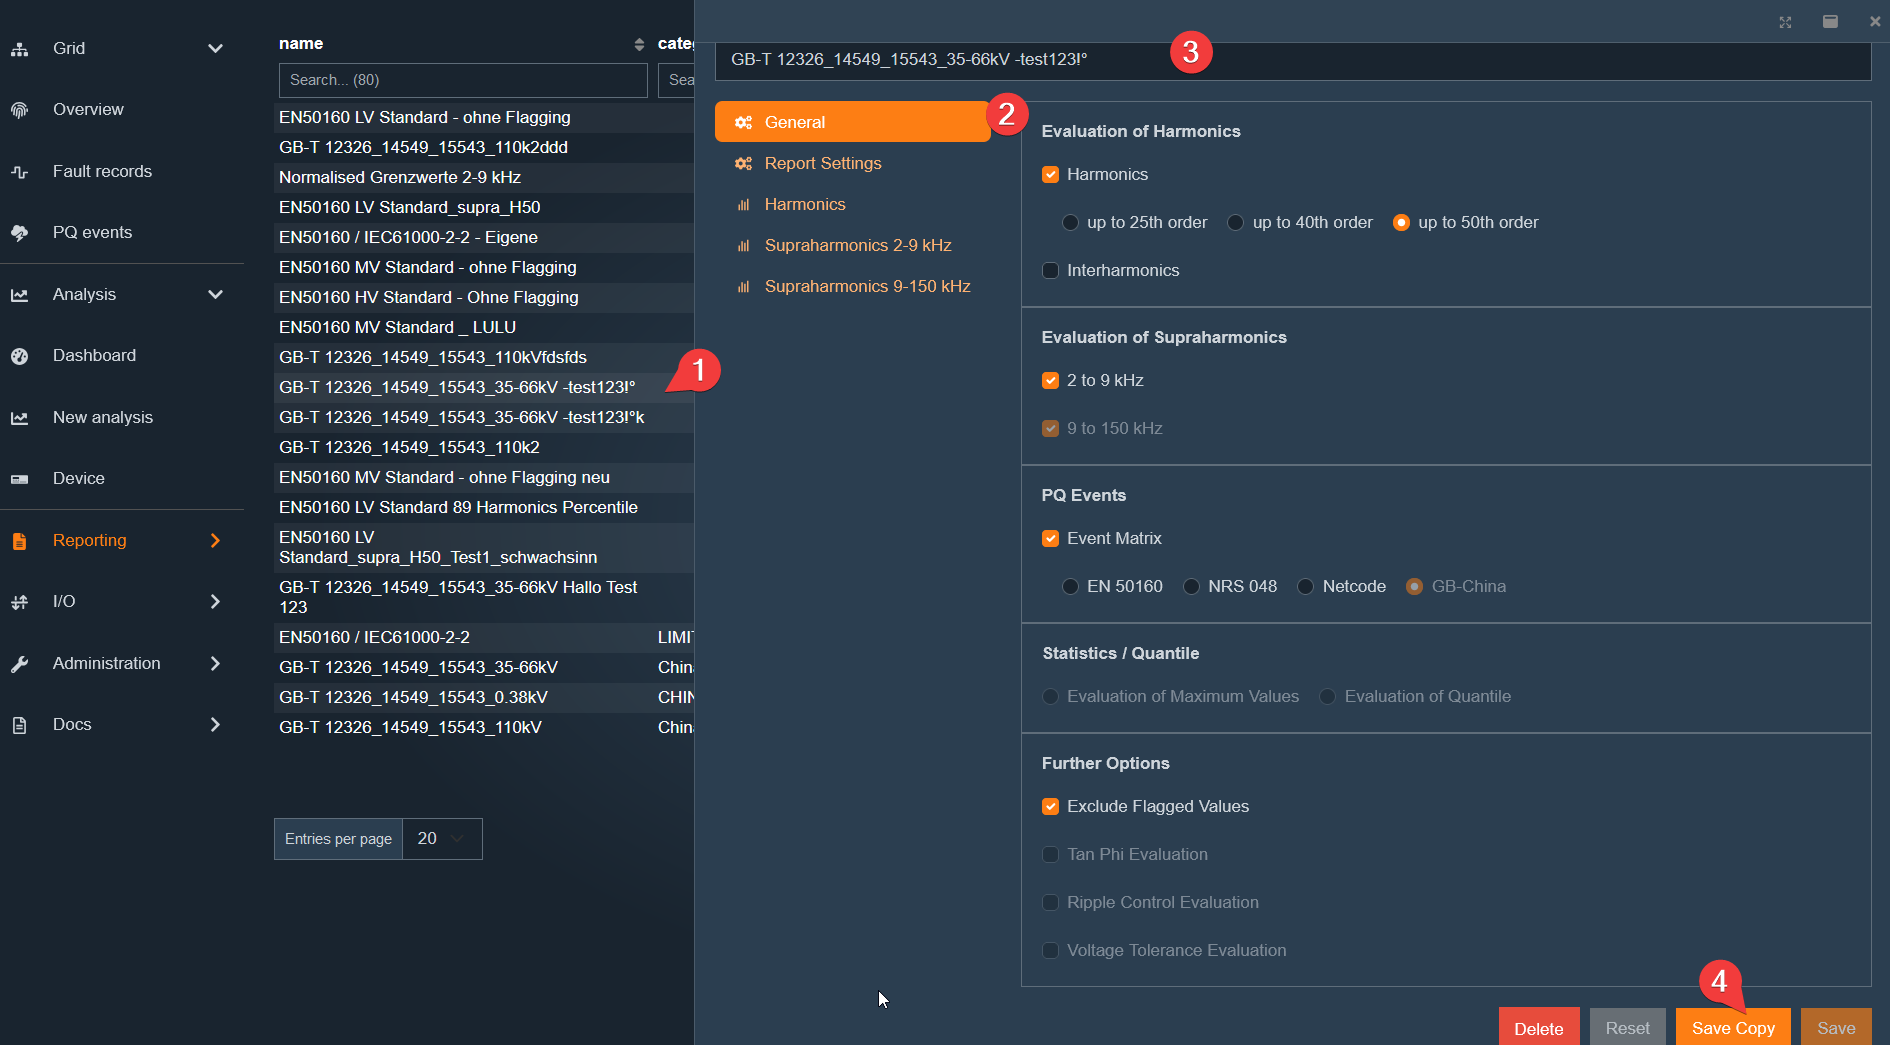
Explanation and usage of the individual sections:
This standard template includes the most common power quality parameters and their thresholds. It can be applied to all devices that record power quality data. This is also possible afterwards, even if the measuring device was previously operated with another template. The template can also be used in analyses to display the thresholds in the charts.
The template has the following parameters in the General section:
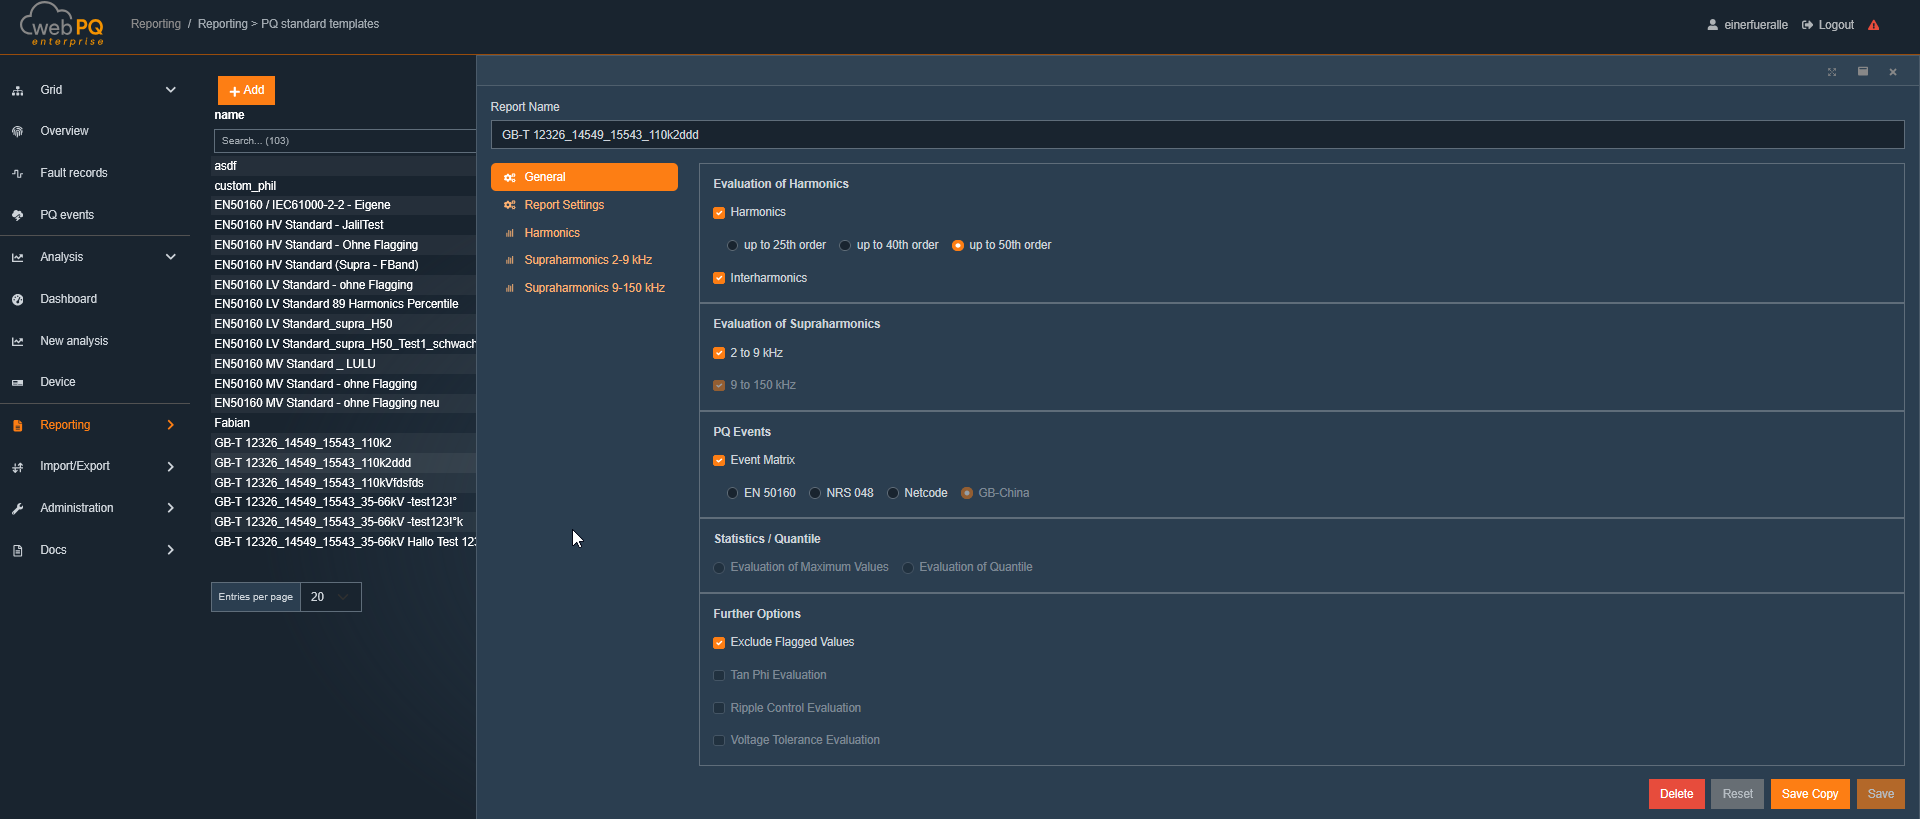
Harmonics evaluation: Set which harmonics should be included in the report. Either up to the 25th, 40th, or 50th harmonic.
Supraharmonics evaluation: Set whether supraharmonics should be included in the report (2-9kHz) or beyond.
PQ Events: Specify which standard to use for ITIC output
EN50160
NRS048
Netcode
Flagged Events: Set whether flagged measurements should be included in the report or excluded.
The current reporting template also affects the generated print output:
The selected harmonics limit controls how many harmonics appear in the report tables and charts.
Harmonics and supraharmonics sections that are not enabled by the template are omitted from the generated report.
WebPQ applies the current pagination and page-break handling again in the PDF output, so page numbering and report splits remain consistent.
For report branding and page format, WebPQ additionally uses the report settings of the current tenant:
A tenant-specific report logo can be stored for PDF generation.
The page orientation can be configured as portrait, landscape, or inherit from the parent tenant.
These settings are resolved before report generation and are used for both manual prints and automated reports.
Configuration in the "Analyses" section FRT Curves.
This feature can be used to work with customer-specific thresholds in analyses or event-based monitoring.
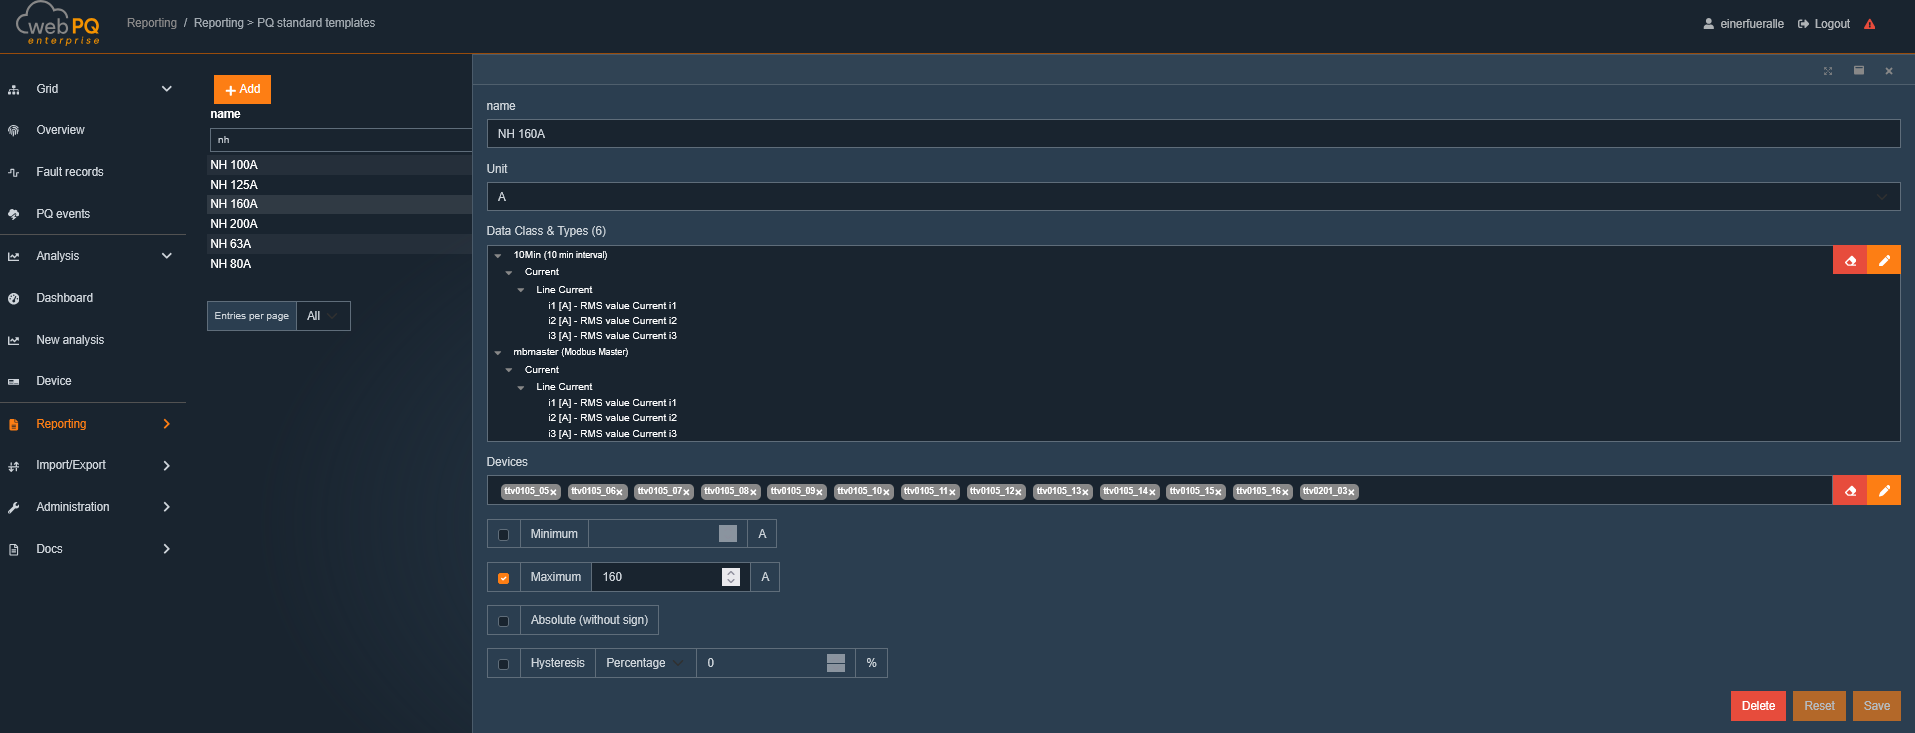
The following parameters can be set:
Name sets the template name to find it in analyses and event-based monitoring of automation tasks. Unit sets the unit for the template, e.g., V, A, kW, kVAr, Hz, etc., to which the threshold refers. Data classes sets the data class for the template, e.g., "Voltage", "Current", "Power", etc., to facilitate assignment of measurements. Multiple data classes can be selected that match the chosen unit. Devices sets which devices the template should be available for. Multiple devices can be selected. Minimum lower threshold for triggering Maximum upper threshold for triggering Absolute sets whether the threshold is considered as an absolute value or with sign Hysteresis sets how far the value must fall below or exceed the defined threshold for retriggering
Click Save to add the template to the list of available templates and apply it to the relevant devices. Click Remove to delete the template.
Thresholds can then be used in analyses – see Thresholds in Analyses – and for event-based monitoring – see Automation Tasks.
Example Use Case:
As a grid operator, I want to monitor local substations and the feeders of a grid area for compliance with EN50160, and also be notified by the system when the current reaches 90% of the NH fuse rating.
The procedure is as follows:
Add several customer-specific threshold templates – e.g., with the name of the fuse size and the definition of the current value at 90% of the NH fuse
Name: NH Fuse 63A – 90%
Unit: A
Data class: Current
Devices: Select all substations or feeders with an NH Fuse 63A
Minimum: empty
Maximum: 56.7 (63A * 0.9)
Absolute: yes
Hysteresis: 2 (i.e., when the current drops to 54.7A, the trigger is reset)
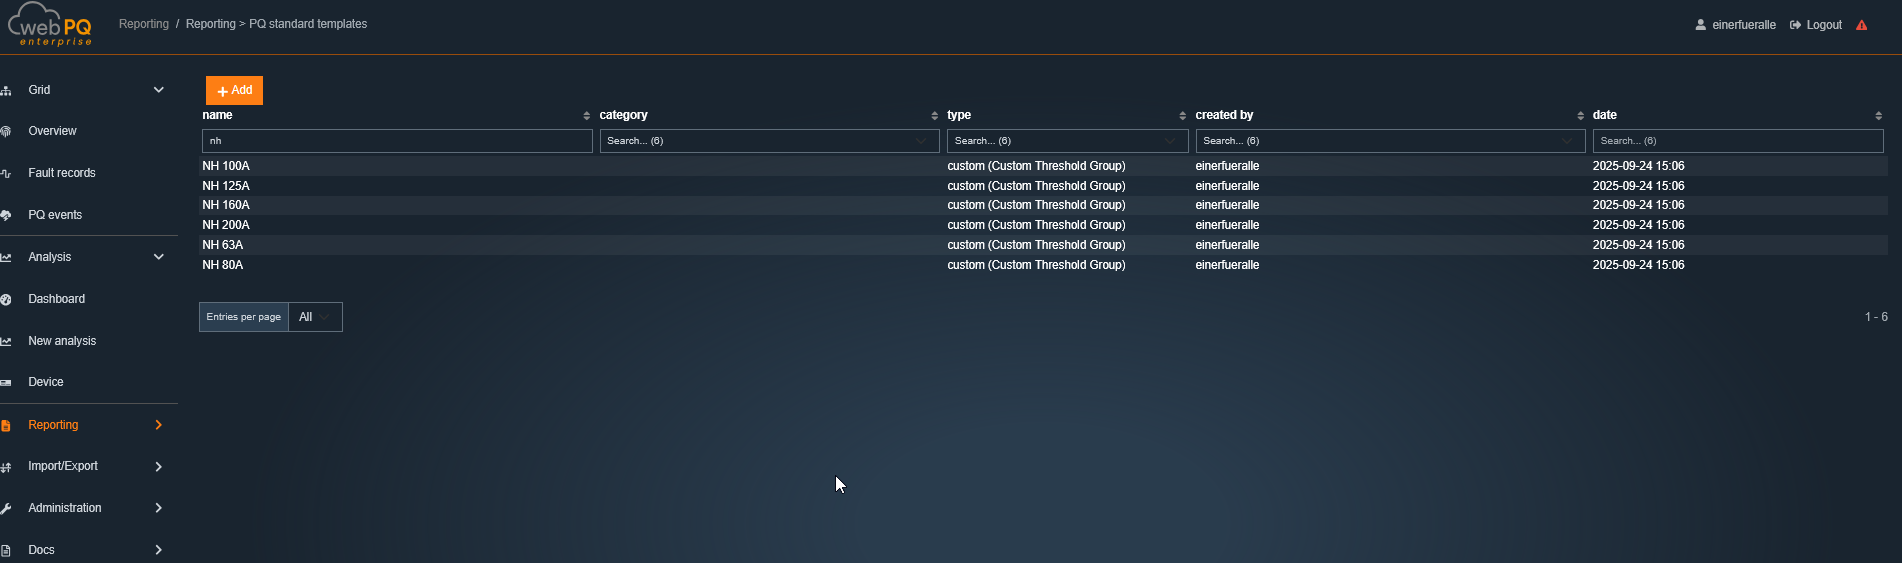
Info: Customer-specific thresholds can also be added in the device settings under the "Thresholds" tab. This allows the template to be applied directly to the device, rather than via device configuration. This is especially useful if the template should only apply to a single device or if you want to control which devices use the template.
Create a dashboard for automated reporting with custom analyses and time selection
Go to Dashboards >> Add New Analysis
Select the desired analyses and configure them with a calculated period (e.g., last 7 days, last month, etc.)
Add the analyses to a new dashboard
Save the dashboard with a meaningful name
Add an automated report in Automation Tasks as event-based monitoring
Go to Templates & Tasks >> Add New Task
Assign a meaningful name to the task and select the task type "Report"
Select the desired devices or device groups to apply the task to
Select the previously created dashboard and configure the recipients
Set triggers in the "Thresholds" section to be notified when defined thresholds are exceeded
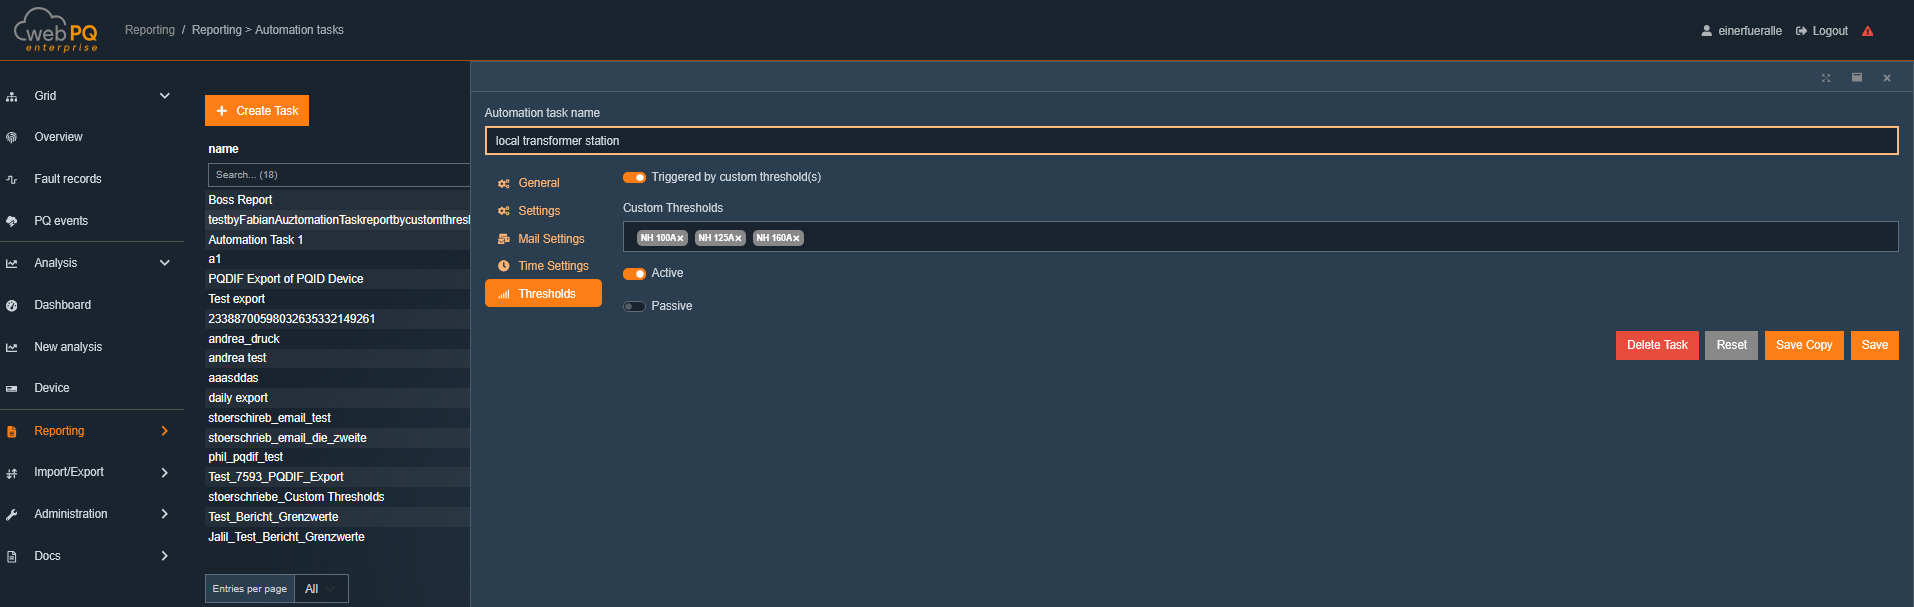
Save and activate the task to start automated reporting and notifications
Result
If the defined thresholds for one or more devices are exceeded, the recipient automatically receives a notification with the freely configured dashboard as a PDF via email.
Generated reports and print views are prepared server-side. WebPQ waits until the included charts and report elements have finished loading before the PDF is created. During that preparation, the report page shows a loading state instead of exporting a partial page.
For EN-style table reports, WebPQ uses a dedicated print mode:
interactive table paging is disabled for the print output,
the print layout applies explicit page breaks and page numbering,
dashboard analyses are printed in their saved layout order.
A central feature of WebPQ is the automated, targeted provision of information for various users or applications. For this purpose, the software has a module for task automation.
A key advantage of the software is its ability to regularly and automatically generate compliance reports, such as those according to EN50160 or VDE-AR user guidelines. Additionally, the software can automatically inform affected customers in the event of network disturbances. In many use cases, the software solution also requires the automatic storage and export of measurement data in open file formats. All these settings and tasks can be configured and managed in the "Tasks" section.
The main tasks enabled by the software's automation functions are listed below:
1. Fault records This module allows automatic alarm notifications to be sent or fault records to be stored, for example, in the event of power grid disturbances. Notifications can be sent via email and include all relevant information about the disturbances. This ensures that users or system administrators are directly and efficiently informed, enabling a quick response to network issues.
2. Reports This function allows standard reports to be created and sent regularly and automatically. Examples include reports according to the EN50160 standard or other industry standards. These reports can be created in various formats, such as PDF. Additionally, the tabs created in the Analysis Dashboard can be used as a basis for automated reports. This enables regular, standardized reporting without manual intervention.
3. Export The export module allows the automatic and regular export of measurement data for one or more devices. The exported data can be stored in open file formats needed for further analysis or archiving. This function ensures that all relevant measurement data is always available in a structured and accessible format without requiring manual exports.
All these tasks and automation processes can be centrally managed in the "Automation tasks" section of the software, allowing for easy configuration and regular execution of automated processes.
The complete reports and exports created in the automation tasks are stored both in the file system of the WebPQ server and in the specified folders that can be configured in the WebPQ backend. More information about the backend can be found at Link. These data can be retrieved at any time.
Additionally, the created data is also available in the "Import / Export" section under "Export" in the client and can be downloaded directly via the browser.
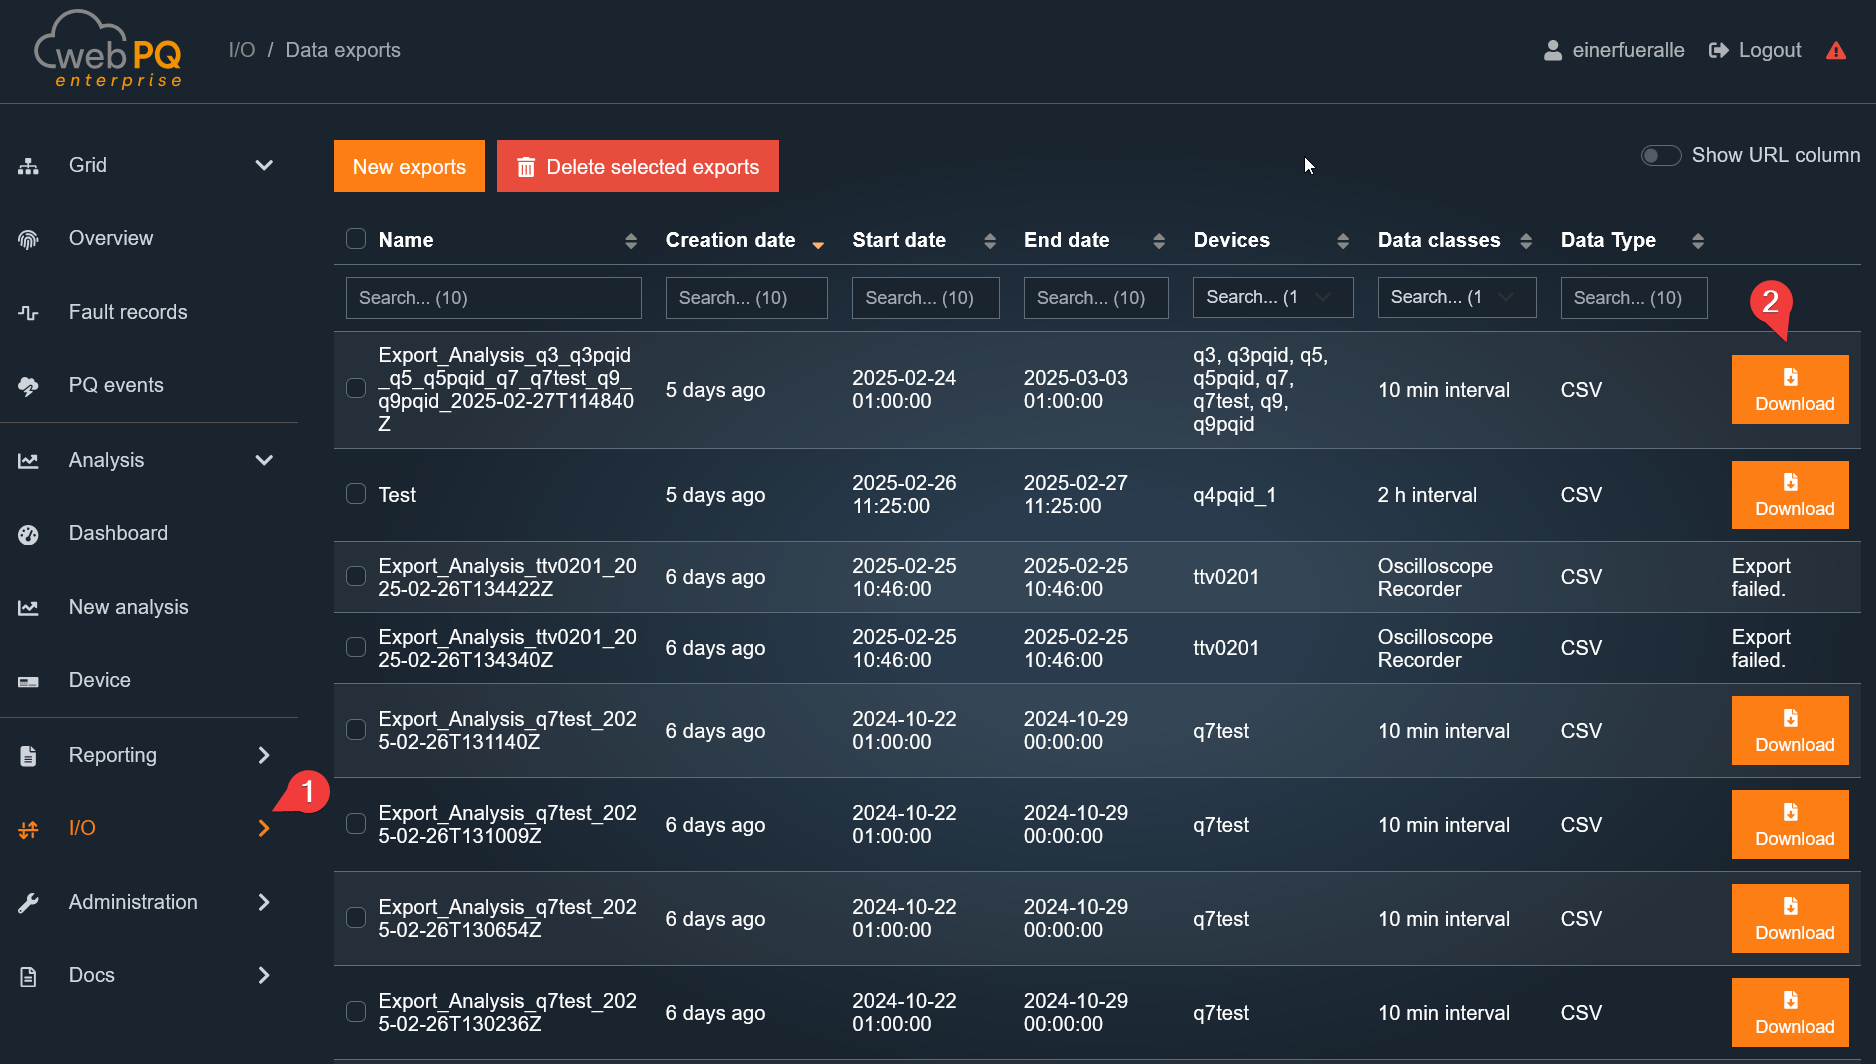
Each task can be activated or deactivated as needed. This allows flexible control over whether a task should be executed or not.
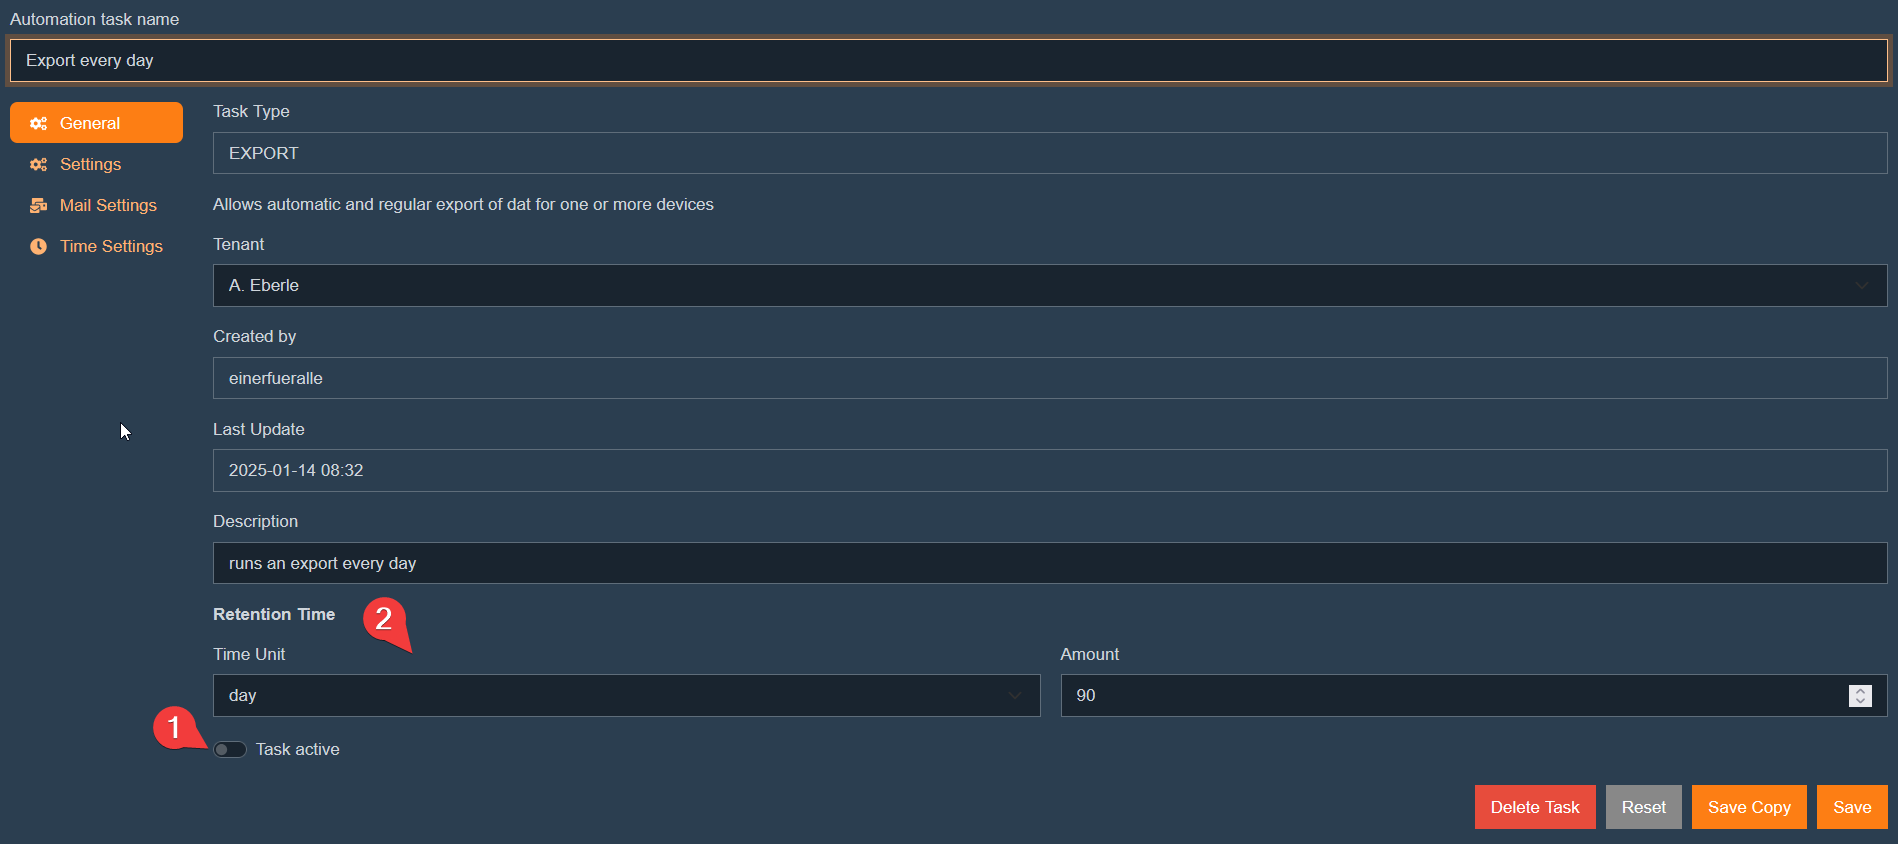
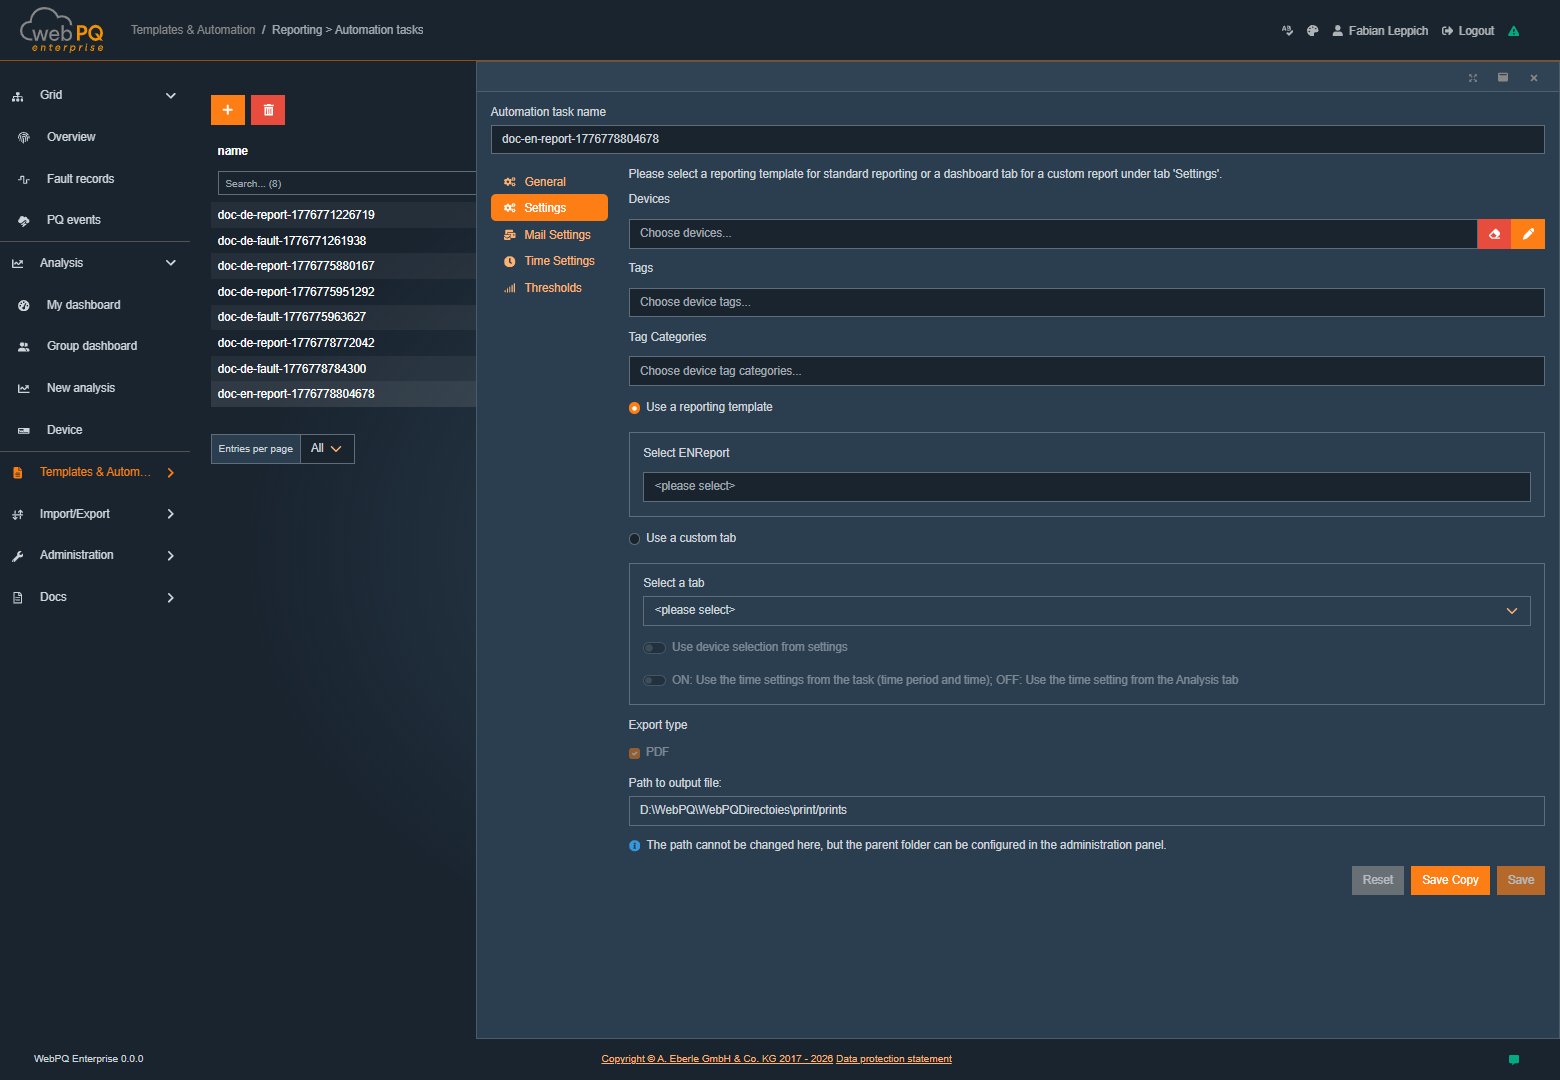
By clicking the "Add Task" button, the user can create new tasks. In the first step, the task name and a description must be specified under which the task will be saved. These details are necessary to uniquely identify and correctly assign the task later.
In the next step, the type of task is determined. This type defines how the task will be executed and which specific parameters need to be configured.
Depending on the task type, the affected measurement points can be selected not only through individual devices, but also through tags and tag categories. This makes it possible to define automation tasks for logical device groups without selecting every device individually.
A typical example is a recurring report for all devices with the "highvoltage" tag. If the automation task is defined through this tag, it will automatically also apply to newly added devices as soon as they are assigned the "highvoltage" tag as well. In that case, the report does not need to be adjusted manually just because additional matching devices were added.
The practical benefit is that existing jobs do not need to be parameterized again for every newly created device. As soon as a new device is assigned to the selected tag or tag category, it is implicitly included in all matching automation jobs of this section.
A commonly used task is the disturbance record. This task allows for automatic notification or logging in the event of a disturbance. The disturbance record is usually sent as an email to defined recipients as soon as a network disturbance is detected. This ensures that responsible persons are immediately informed, allowing for a quick response.
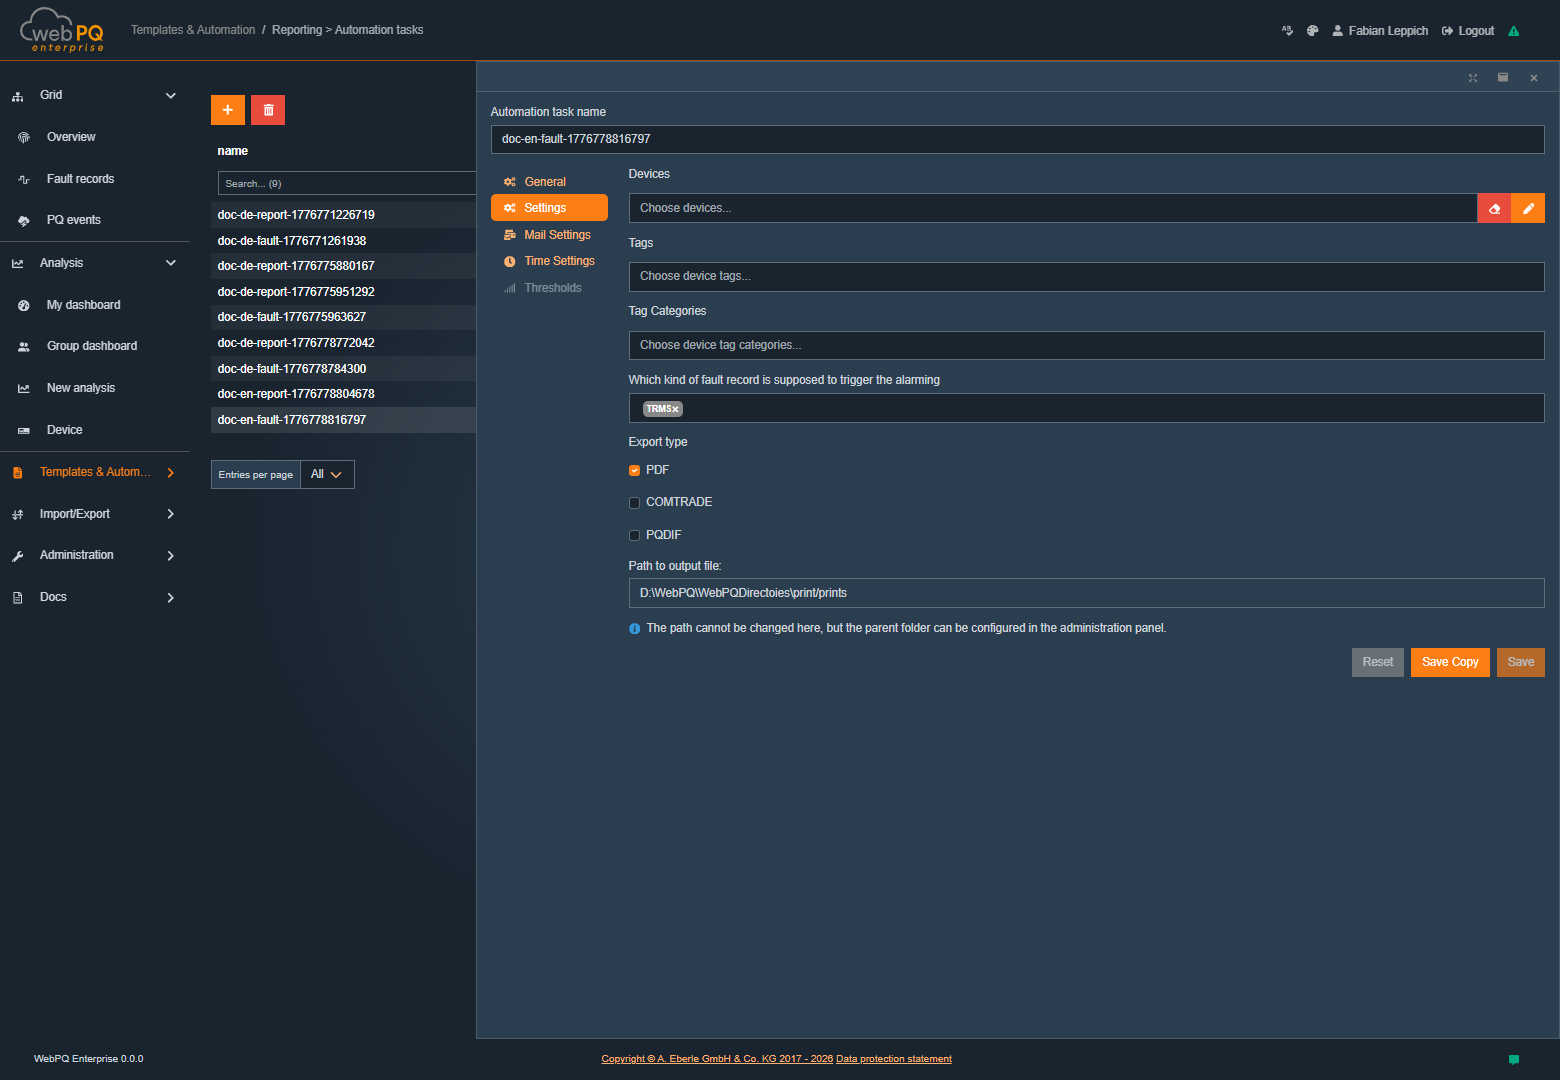
With #1, the task name is specified. Under #2, settings can be made regarding which devices, tags, or tag categories are eligible for sending and which reporting format (e.g., PDF or COMTRADE) should be chosen. Additionally, the type of record can be set in the settings, such as oscillographic or TRMS record (True Root Mean Square), which affects the type of measurement data representation.
The same advantage applies here: if the selection is based on tags or tag categories, newly created and correspondingly assigned devices are included automatically. Existing disturbance-record jobs therefore do not need per-device follow-up parameterization.
In the email settings, the recipients, subject, and formats must be specified. It is also possible to include variables to create individual subject lines or email texts. This function offers high flexibility as the content of the emails can be tailored to specific requirements and circumstances.
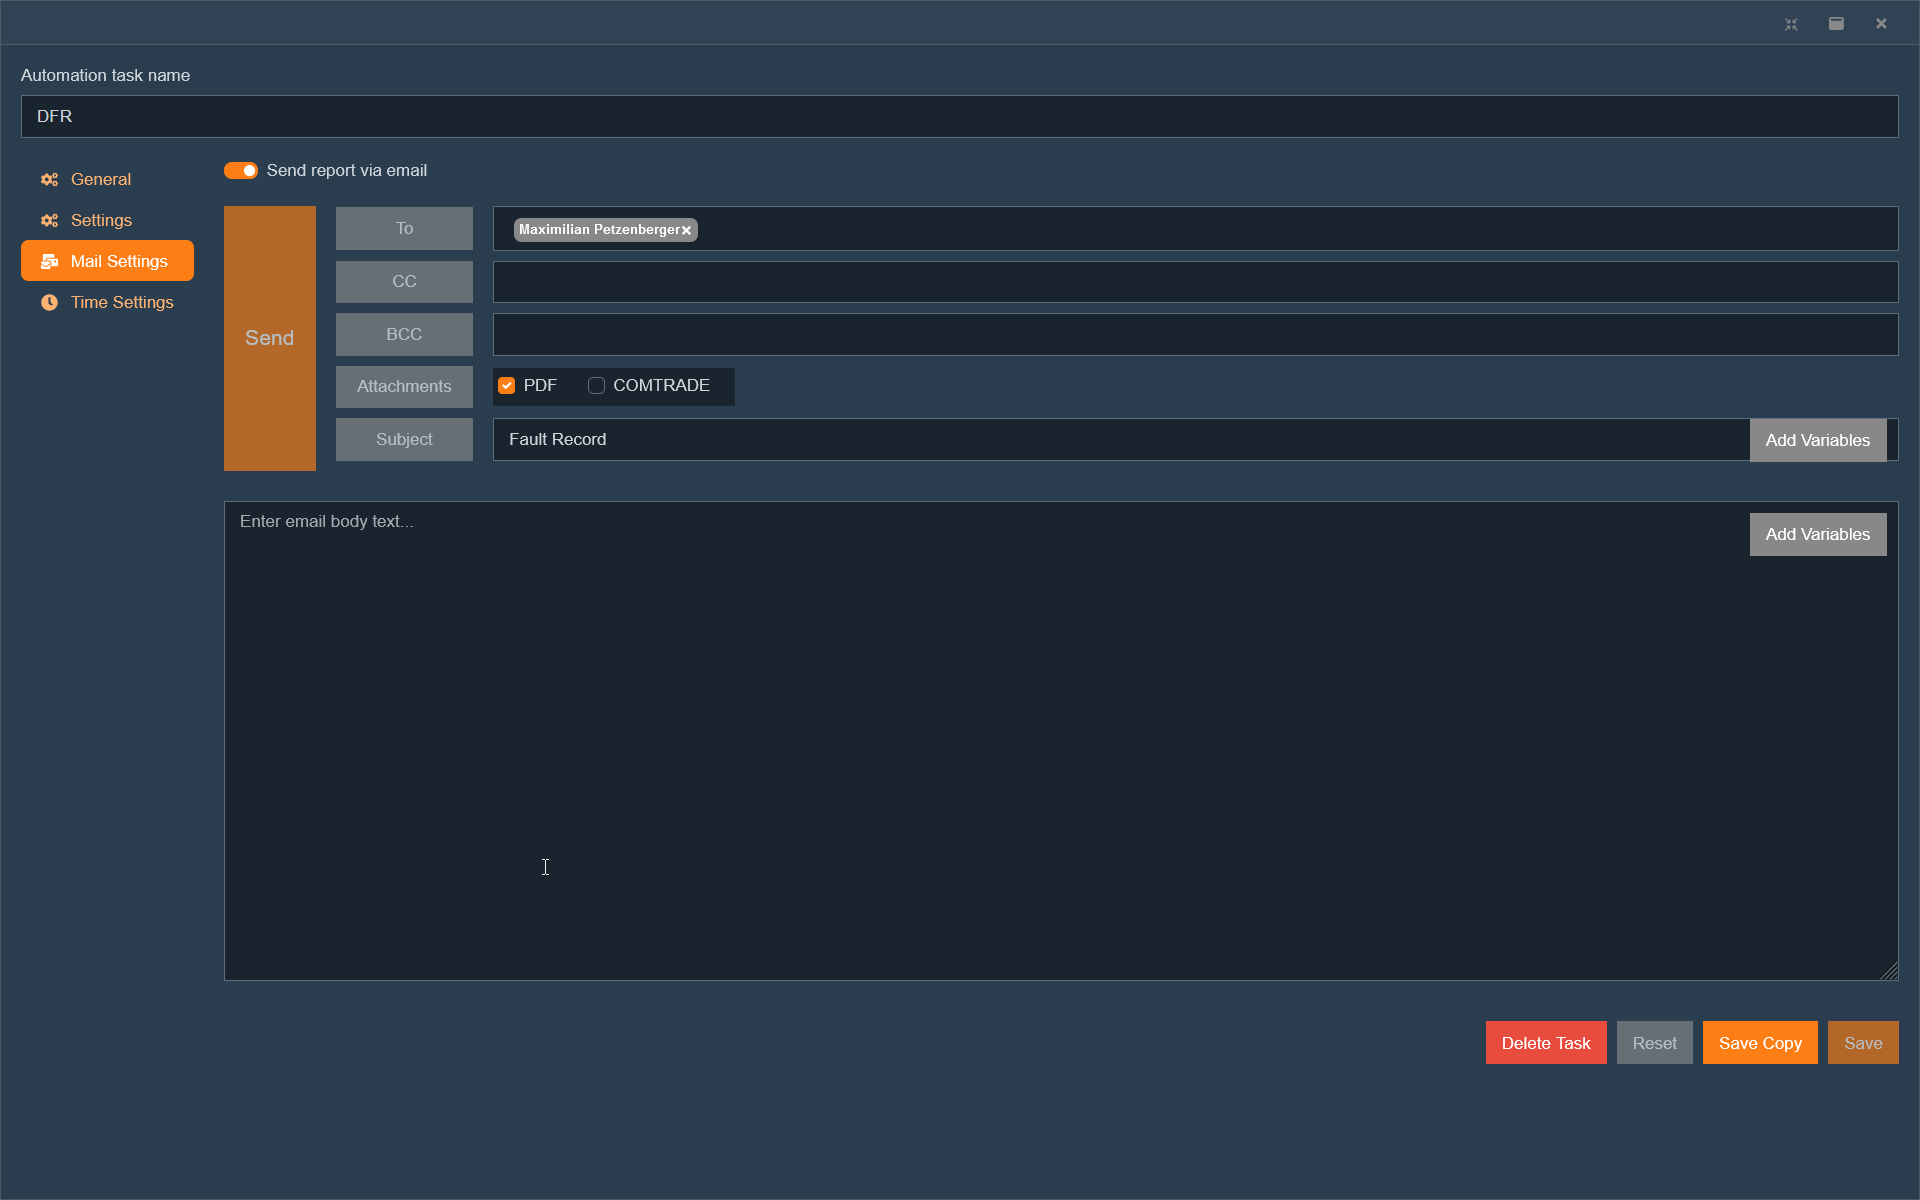
In the time settings section, specific parameters can be set, such as how far back the disturbance record should be considered. This allows defining the period in which disturbances can be processed or analyzed retrospectively and determining how long historical data should be sent.
Using the reporting templates and the analysis dashboard, the WebPQ software offers the ability to automatically generate PDF reports according to standards from over 65 different templates. These reports can be created for device groups or individual devices.
In the automation task settings, the affected devices, tags, or tag categories as well as the report template must be selected. These templates can be customized in the reporting editor either according to standard specifications or customer-specific requirements.
This is especially useful in growing installations: when a report is defined through tags or tag categories, newly added devices become part of the existing job automatically after they are assigned accordingly, without reopening and extending the report configuration.
For more customized reports, the software offers the ability to create free reports from various types of analysis using the individually configurable tabs in the analysis dashboard. To do this, simply select the desired tab under point #2.
In the time settings section, specific parameters can be set, such as frequency, day of the week, and time at which the regular report should be generated. This function enables complete automation and scheduling of report generation without manual intervention.
For automated report emails, WebPQ supports placeholders that are filled during task execution. Depending on the task and the available device metadata, placeholders can insert values such as the report ID, report description, station ID, group, plant, field, device, recorder information, trigger time, or generated file name into the subject or body text.
Automated reports use the same generation pipeline as manual print jobs. Therefore:
tenant-specific report logo and page orientation are applied automatically,
the report is rendered only after the required report elements finished loading,
the generated output can later be checked through the regular Import / Export > Export overview when the task stores files there.
Unlike reports, the export task mainly differs in the settings. While the selection of affected measurement points is similar to reports and can also be done through devices, tags, or tag categories, the export format must also be selected here. The export allows measurement data to be stored in various formats.
Export tasks benefit from the same pattern. If the selection is made through tags or tag categories instead of single devices, newly added devices are picked up automatically as soon as they belong to the configured group.
Currently, the following export formats are available:
For CSV export, after selecting the format, the data class or data points to be exported must be specified. This provides the flexibility to export only the relevant data in a structured CSV format.
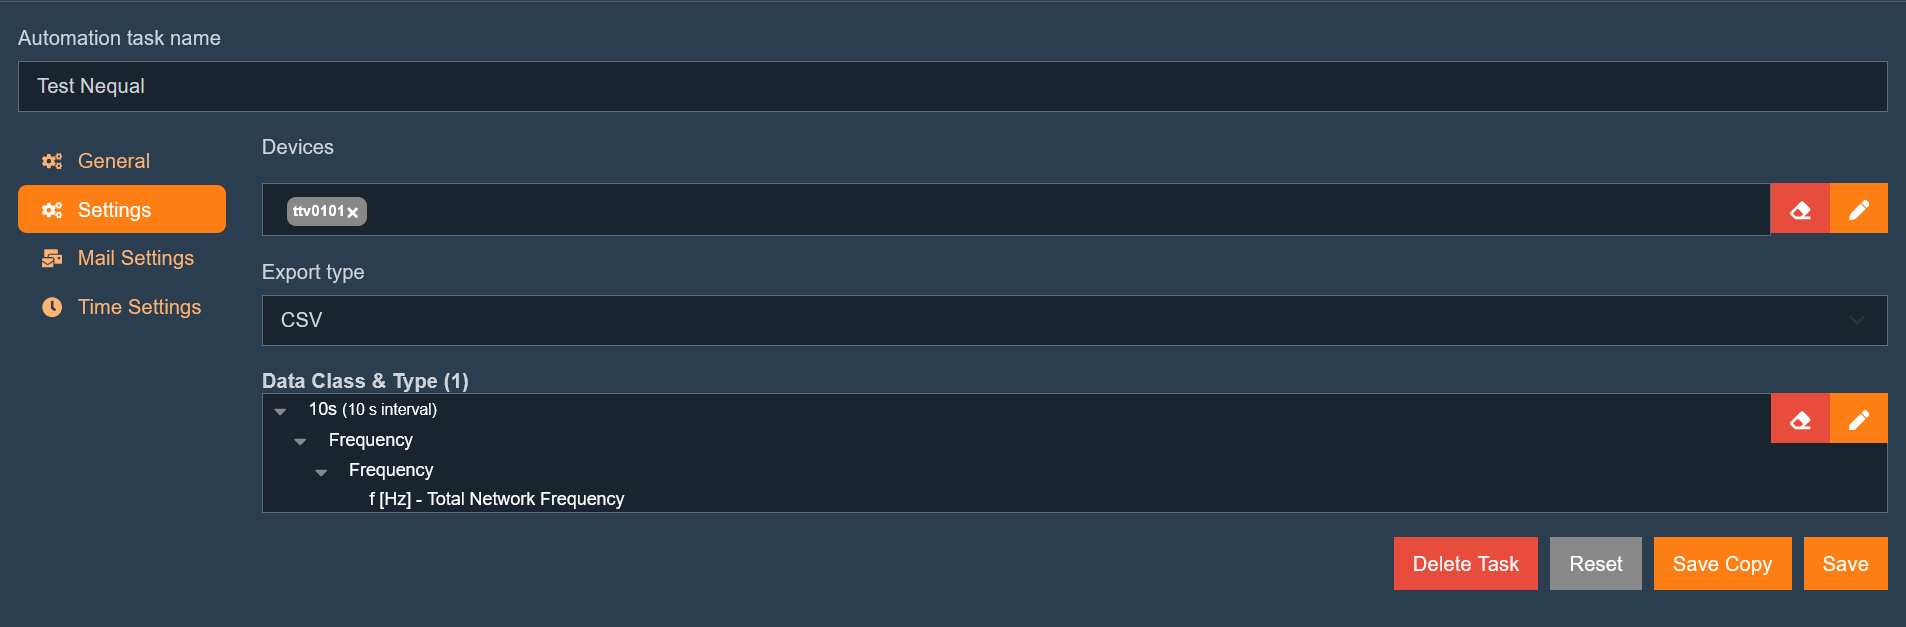
For NeQual export, the number of weeks, the country, and the start time of the export period must be specified. These settings allow data to be exported for specific periods and geographical regions.
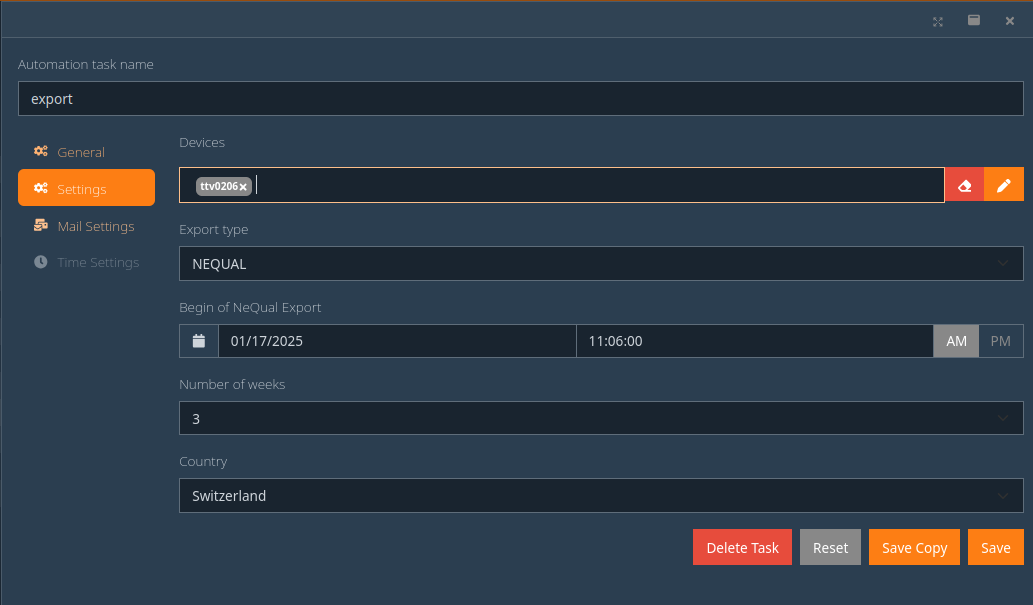
After an automation task starts an export, the generated file also appears in the regular Import / Export > Export overview. This is where completed files can be downloaded and failed exports can be checked together with their error text.
To import measurement data into the WebPQ software, various options are available. The import can be performed either manually via the client or automatically through direct connection via TCP/IP.
A manual import is used when there is no direct connection to the measuring device or if such a connection is not desired. Additionally, measurement data from other systems or from end customers can be imported this way.
In the Import / Export >> Import section, you will find the function for manual import. This allows you to upload data that has been exported, for example, via SD card, WebServer, or WinPQ Lite.
This page describes the import of measurement data. To transfer devices that already exist in WinPQ into WebPQ, use Administration > Devices > + Import from WinPQ instead. The device import workflow is described in Devices under Importing Devices From WinPQ.
To import PQ-Box data, first select the PQ-Box import type in the import wizard. After that, choose the directory that contains the exported files.
During PQ-Box import, WebPQ processes supported .pqf measurement files and assigns their contents to the data classes used in WebPQ. Sidecar files such as parameter, info, or comment files may be present in the selected directory. Unsupported log files are not imported as measurement data.
Imported cyclic data and recorder data use the same data-class names as PQI device data. This means PQ-Box data is available consistently after import in analyses, exports, reports, and synchronization views.
To import COMTRADE data, select the Comtrade import type in the import wizard. This option is visible only when the COMTRADE import add-on is enabled in the license.
Each COMTRADE import group must contain at least a .cfg file and a matching .dat file. Optional .hdr, .inf, and .cff files are also considered when they belong to the same COMTRADE group.
On the file side, WebPQ uses the Rec-ID from the COMTRADE metadata, more precisely the identNumberOrDeviceName field, as the identifying value. This value can be used in the wizard to group related files. The actual assignment inside WebPQ, however, is not based only on this identifier. It is made in the mapping step by assigning the import to a specific COMTRADE device.
In the mapping step, WebPQ shows the channels from the configuration file. These channels must be assigned to a COMTRADE device and to the target channels in WebPQ. If no suitable COMTRADE device exists yet, create it directly from the import dialog or beforehand in device management.
If a channel mapping has already been stored for that COMTRADE device, WebPQ can reuse that mapping in later imports with matching channel names. In this context, the Rec-ID is mainly used for grouping and recognition of import files, not as a complete replacement for the device selection in the wizard.
Missing .cfg/.dat pairs, unreadable configuration files, or files with too many analog channels are shown in the wizard before upload. Warnings and import errors from the actual import run are also written to the import log.
The manual import is carried out in several steps:
Click on "Import data for devices" (#1).
A wizard will guide you through the import process.
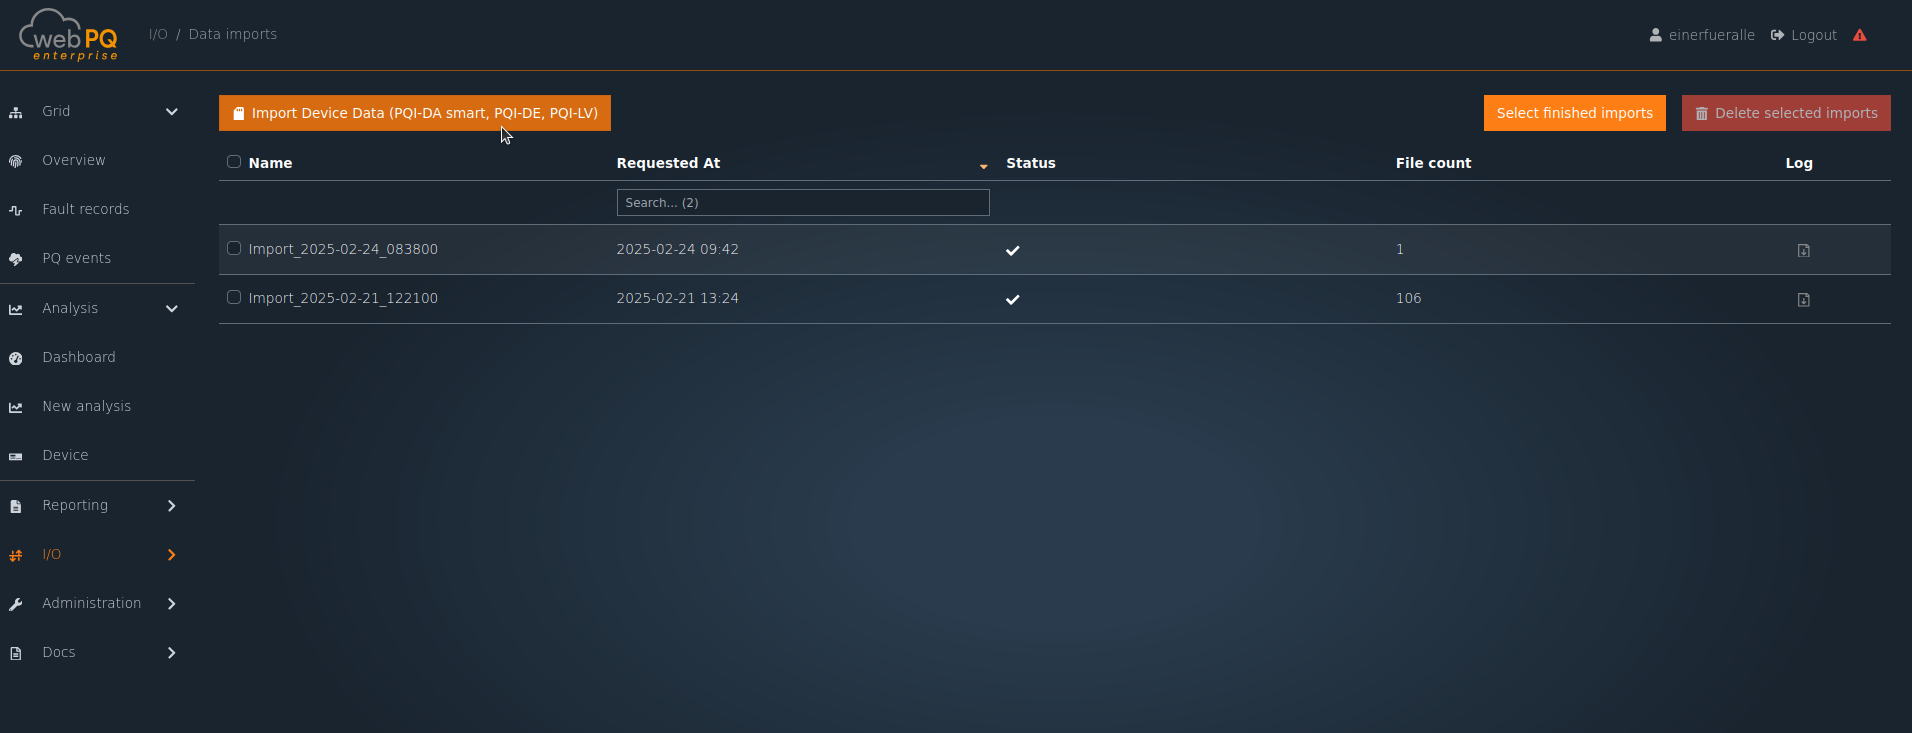
Select the import type that matches the source files. For PQ-Box imports, select PQ-Box before choosing the files from the SD card or export directory.
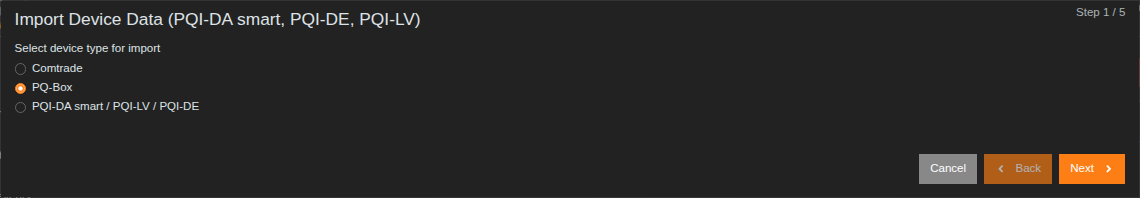
For COMTRADE imports, select Comtrade. This option is visible only when the COMTRADE import add-on is enabled in the license.
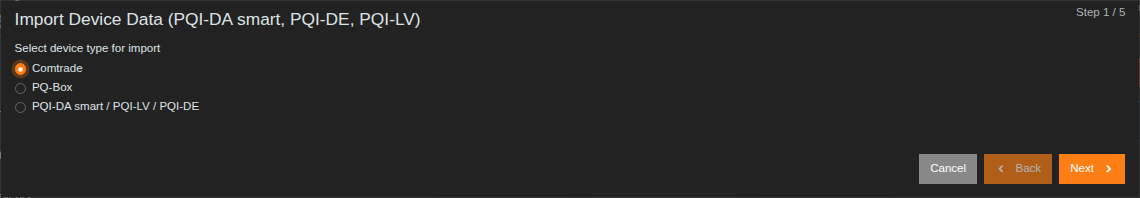
Click on "Browse" to select the directory with the measurement data.
Confirm the security message regarding the trustworthiness of the application.
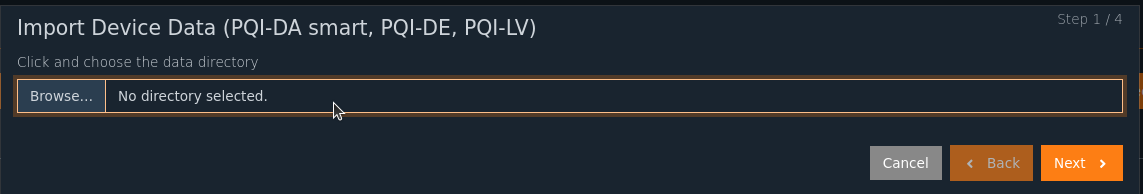
Note: You must agree to the security message!
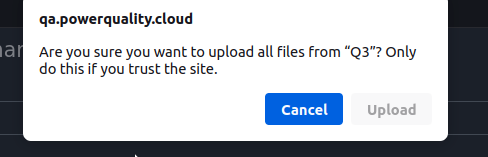
Files must be assigned to the respective devices.
Known devices are automatically recognized by the serial number.
Manual assignments or changes can be made in the table.
If the device does not yet exist, it can be newly created as an "Offline Device".
For PQ-Box imports, WebPQ reads supported .pqf measurement files and assigns their content to WebPQ data
classes. Sidecar files such as parameter, info, or comment files can be part of the selected directory, but unsupported
log files are not imported as measurement data.
PQ-Box cyclic and recorder files are displayed with the same data-class names that are used for PQI devices. This means imported PQ-Box data appears together with other device data in analyses, exports, reports, and synchronization status views.
For COMTRADE imports, each import group must contain a .cfg file and a matching .dat file. Optional .hdr,
.inf, and .cff files are included when they belong to the same COMTRADE group.
The Rec-ID contained in the file (identNumberOrDeviceName) can be used to group COMTRADE files. The assignment to the WebPQ device is then made in the wizard through a COMTRADE device and its channel mapping.
The COMTRADE mapping step shows the channels from the configuration file. Assign the channels to a COMTRADE device and to the target WebPQ channels. The wizard can group COMTRADE files by directory, Rec-ID, or equal channel structure.
If no suitable COMTRADE device exists yet, create one from the mapping step or in Administration > Devices before completing the import. Check the device time zone and channel mapping carefully, because they determine the timestamps and channel names used after import.
Missing .cfg/.dat pairs, unreadable configuration files, and files with too many analog channels are shown in the
wizard before upload. Import warnings and database-side messages are written to the import log after the import job has
run.
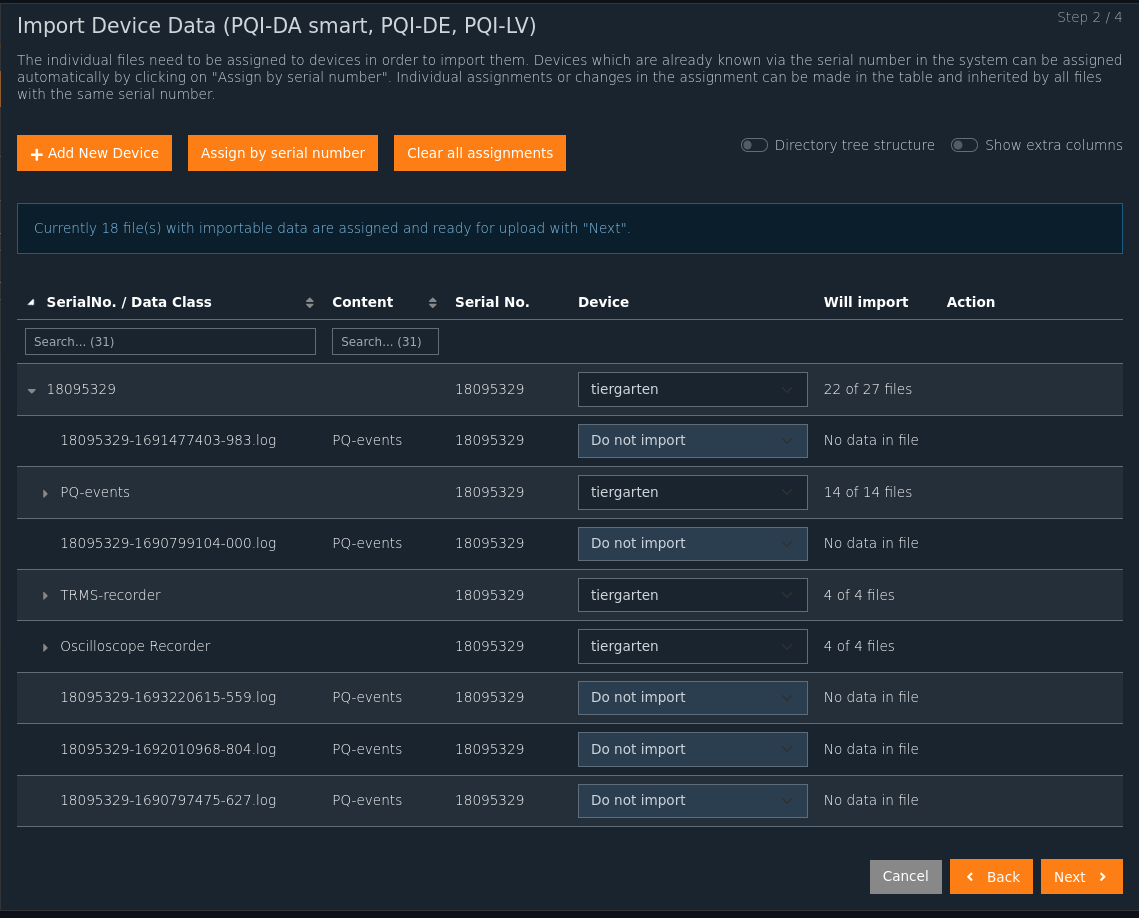
The data is uploaded to the server.
Subsequently, the automatic import into the database takes place.
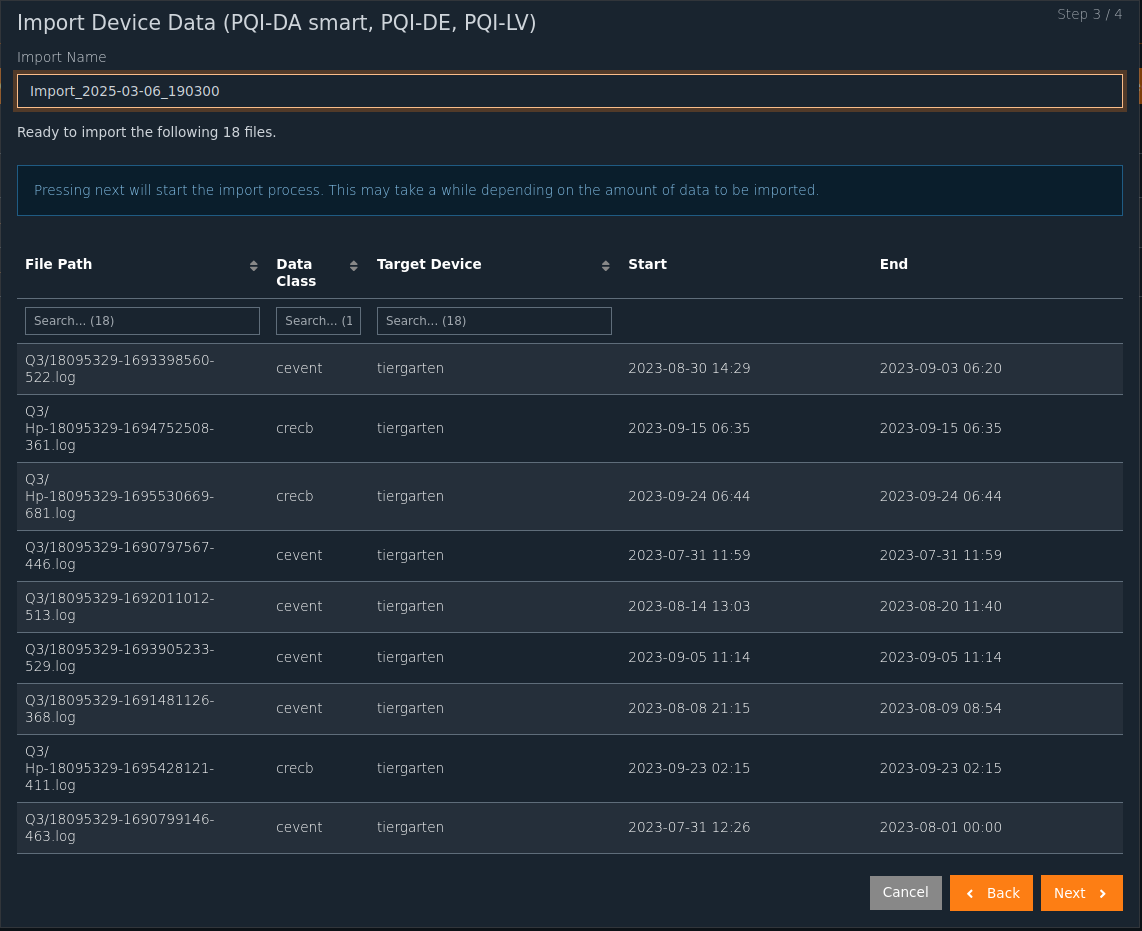
The progress of the import can be viewed in the Import / Export >> Import section.
A LOG file is created for each import process to trace the process.
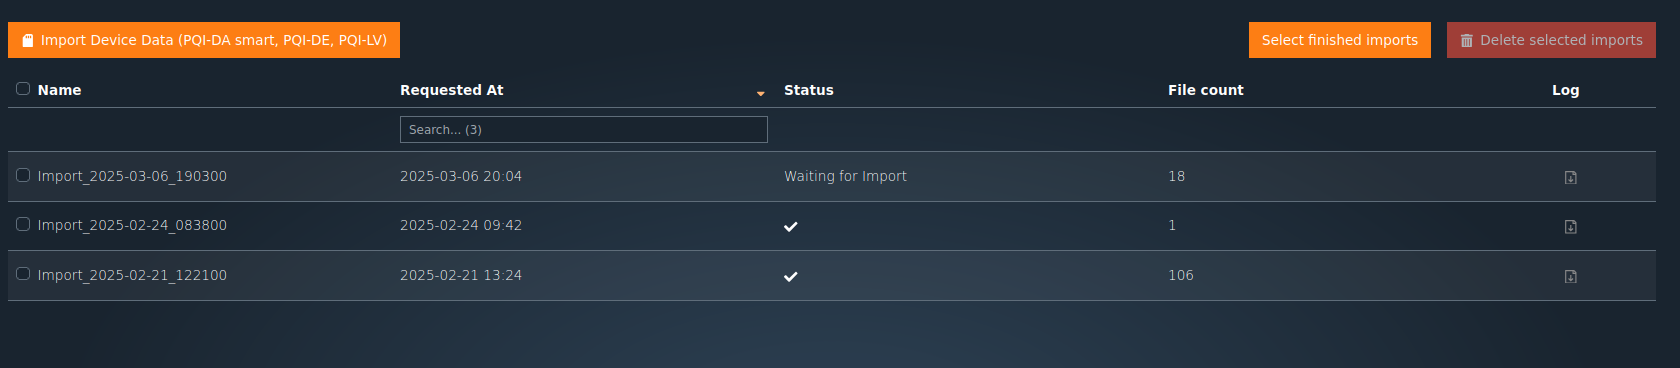
The WebPQ software offers both manual and automated export options for measurement data.
In the Import / Export > Export section, you can:
Create manual exports,
View and download already created exports,
Manage exports from the Automatic Export.
Exports are created as background jobs on the server. This means the export can continue even when larger data ranges take longer to prepare, and the result becomes available in the export overview as soon as processing finishes.
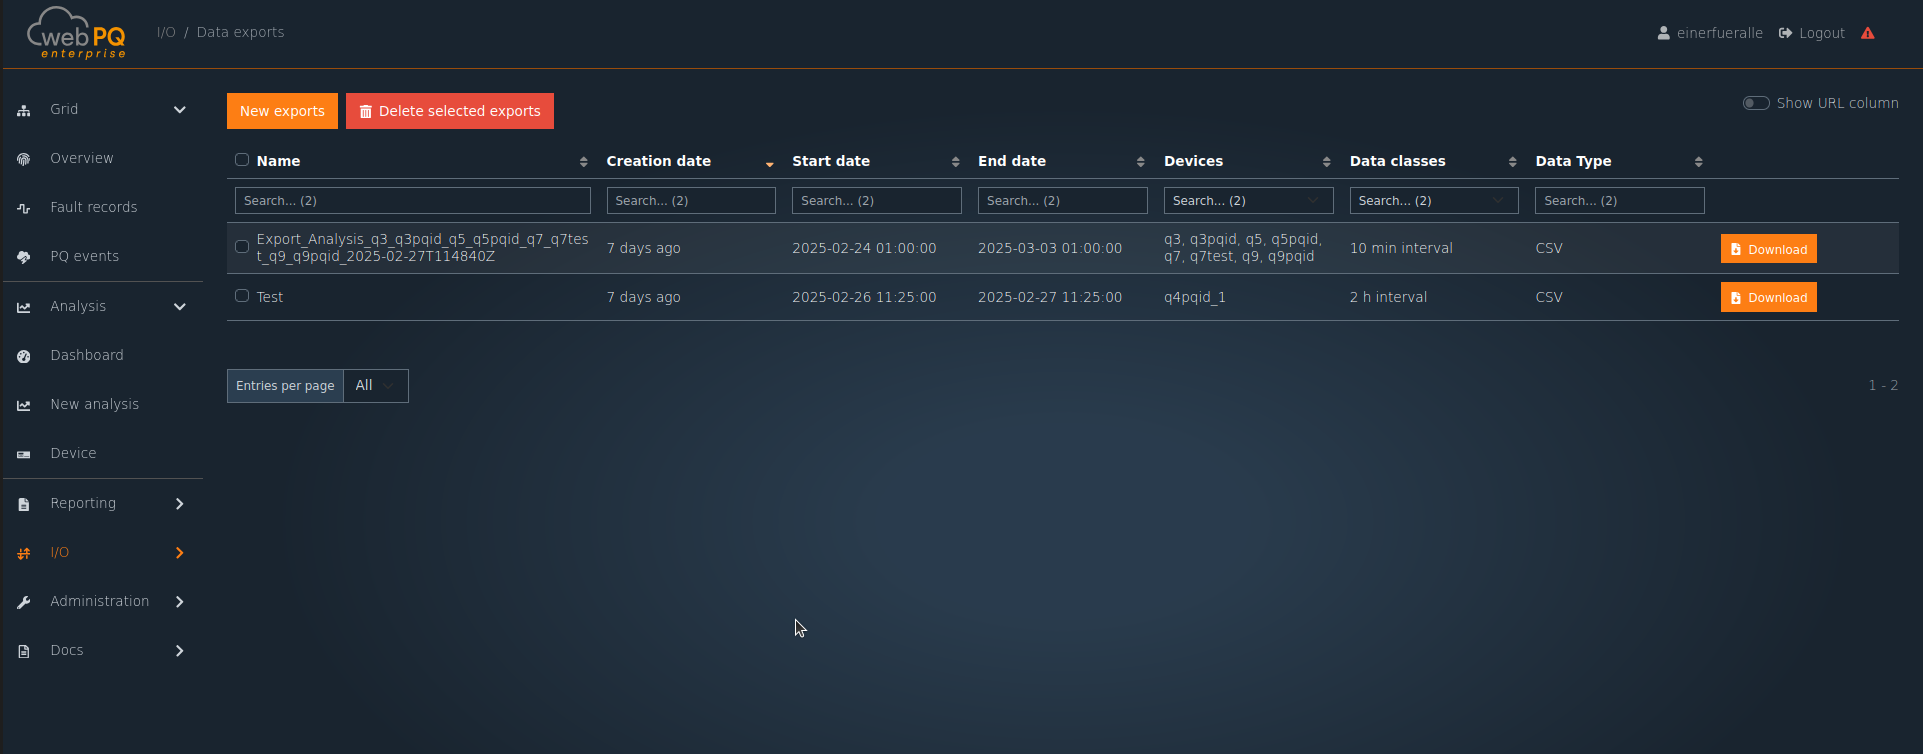
A manual export is carried out in several steps:
Click on "New Exports" to open the export creation dialog.
Define a meaningful export name for later identification.
Select the desired export format:
CSV (Text-based table format)
Nequal(license required)
PQDIF(Power Quality Data Interchange Format: IEEE 1159)
Tip: For the formats PDF and Comtrade, other methods for creating reports and exports are available. For more information, see Export via Burgermenue.
Select the measuring devices for which the export should be created.
Set the desired export time period.
Select the relevant data classes for the export.
Depending on the selected export type, additional validation rules apply:
CSV and PQDIF require at least one device, at least one data class, and a valid time range.
The end date must not lie in the future.
The selected time period must have a positive duration.
NeQual additionally requires the country and the permitted number of weeks for that country.
As long as the parameter set is incomplete or invalid, the confirmation button remains disabled.
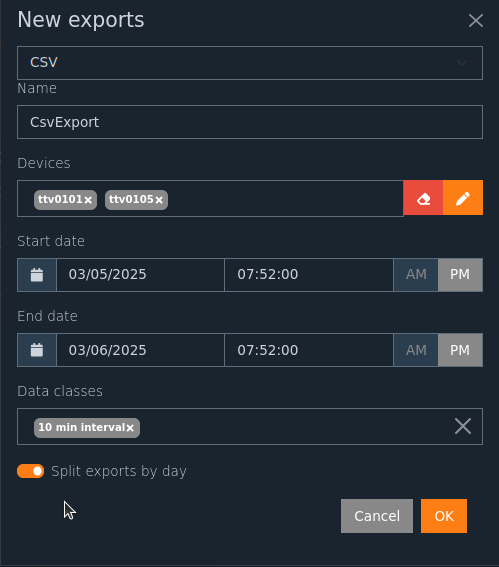
After all settings have been made, the export is started on the server by confirming with "OK".
While exports are in status Pending or In Progress, the overview refreshes automatically more frequently so that progress changes and completed downloads appear without a manual reload.
The status of all exports is displayed in a table.
Historical exports are also available in the overview.
After the export is completed, the data can be downloaded via the download button.
The overview contains both manually created exports and files created by automation tasks. Each completed export is provided as a ZIP file, even if the selected export format inside that ZIP is CSV, PQDIF, or NeQual.
The status column shows the current processing state:
Pending: The export job has been created and is waiting to run.
In Progress: WebPQ is currently processing the export and shows a progress bar.
Completed: The ZIP file is ready and can be downloaded directly.
Failed: The export did not finish successfully. The table provides the failure message in the status field.
For supported formats, the New from row action can be used to open a new export dialog with the parameters of an existing export already prefilled. This is useful for repeated exports with the same scope.
Finished or obsolete exports can be removed from the table again. This deletes the export entry and the associated server-side export data for the selected rows.
If an export fails, WebPQ also writes a corresponding Syslog error entry. This makes failed exports traceable in operational monitoring in addition to the error text shown in the export table.
The storage of exports is configured on the server-side.
It is recommended to choose a directory with sufficient storage space.
Regular backups of export data are recommended to avoid data loss.
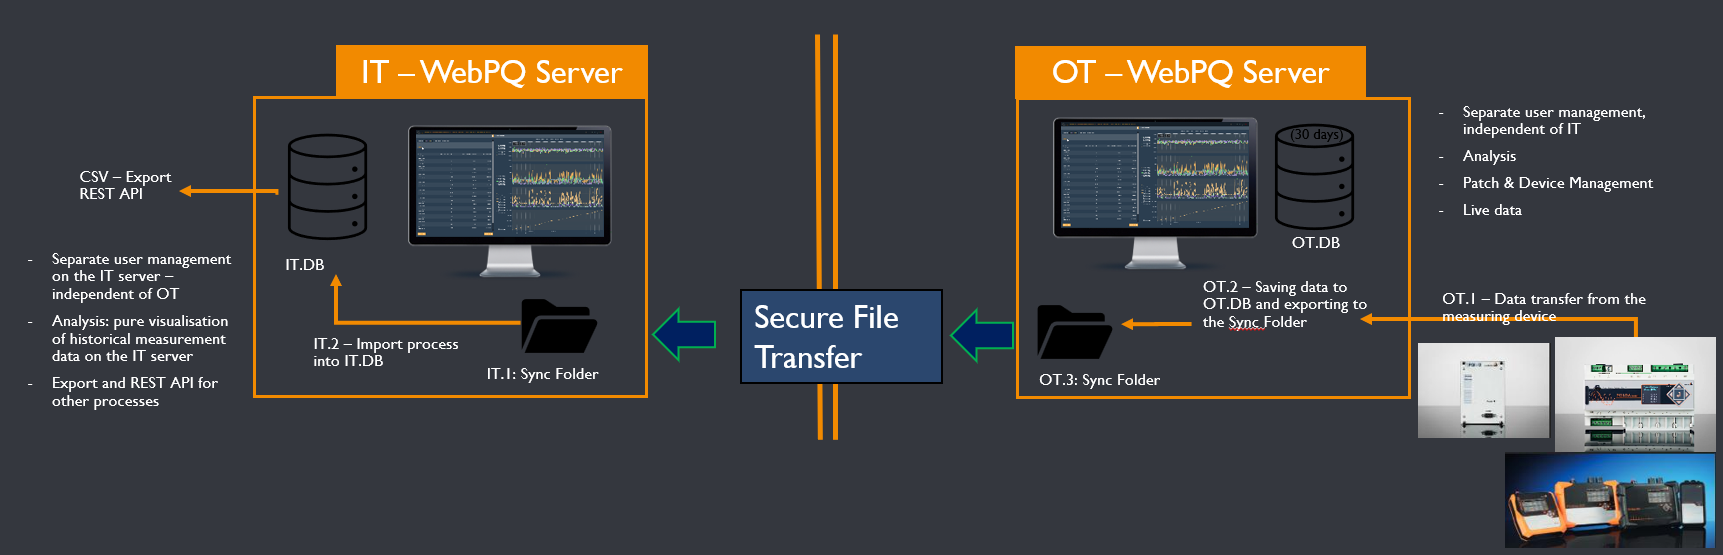
Data Synchronization in WebPQ is implemented as a file-based one-way transfer between two separate instances. The actual transfer path between OT and IT is intentionally not handled by WebPQ itself, but by an on-site mechanism such as a data diode, rsync, scp, or a comparable secure file transfer solution.
The flow follows the implementation directly:
Export on the OT system
As soon as measurement data has been written successfully to the database, WebPQ creates one sync file per device and data class in the configured export folder. The files are stored in a folder structure following the pattern exportFolder/deviceName/dataClass/.
File types and ordering
WebPQ uses continuously numbered files. During normal operation, it creates incremental files such as device-dataclass-sequence.aed or, when compressed, ...aed.snappy. For full snapshots it creates ...full.aed or ...full.aed.snappy. For additive historical gap backfills it creates ...historical.aed or ...historical.aed.snappy.
Unidirectional transfer
These files are copied from the OT sync folder to the IT sync folder. Because WebPQ itself does not require a return channel, this transfer path can be operated with strictly unidirectional security components.
Import on the IT system
The import process scans the configured import folder every 15 minutes for new device-data-class combinations. For combinations that are already known, it then checks every 10 seconds whether the next expected file number is available.
These two intervals are currently part of the fixed OT/IT bridge implementation. They are not exposed as separate export/import settings in the WebPQ administration interface and therefore cannot be adjusted directly by a user.
Completeness and ordering checks
A file is processed only after WebPQ detects that it is complete and finalized. WebPQ then imports files strictly in file order. A full file replaces the current data set on the target system for the affected device/data-class combination. historical files and normal incremental files are imported additively.
Automatic device creation on the target system
If the device does not yet exist on the IT system, WebPQ creates it automatically on the first successful import as an offline device, with the description Imported via data sync and the tag syncimport. This keeps imported synchronization devices easy to identify in administration views.
Synchronized contents
In addition to the measurement rows, WebPQ also transfers the technical metadata required to interpret them correctly, such as data-class assignments, time-zone information, recording configurations, and device hierarchy data. OT-side connection details such as IP addresses are not exported.
The Data Synchronization (OT / IT Bridge) feature writes measurement data automatically into a file when it is stored in the database. This file can then be transferred by third-party tooling such as rsync, scp, or data diode solutions to another server, where a second WebPQ instance can import it. This enables secure OT-to-IT data communication without a return channel and preserves strict network separation. The synchronization files contain measurement values plus measurement metadata such as timestamps and device names, but not OT-sensitive connection details such as IP addresses. Data Synchronization supports both one-time and continuous synchronization. It can also be used for measurement-data backups, but it does not replace a full database backup.
Why use data synchronization with unidirectional transfer?
Secure separation of OT and IT systems is essential in critical infrastructure environments such as energy, water, and manufacturing. Data diodes and similar one-way transfer solutions are often not optional, but mandatory:
Network security: OT systems are protected from cyber attacks and malware originating in the IT network. A physical data diode enforces strict one-way transfer.
Compliance: Many regulations such as NERC CIP, IEC 62443, and ISO 27001 require unidirectional transfer paths with physical separation.
Ransomware protection: Measurement data can flow safely into the IT system while the IT system cannot send commands back into the OT environment.
Data Synchronization supports both one-time and continuous synchronization. It can also support measurement-data backups, but it is not a replacement for a full database backup.
For Data Synchronization (OT / IT Bridge) to work, the following technical requirements must be met:
File system and access:
Both WebPQ instances must have access to the same file system or use an on-site transfer mechanism between the two systems. File locking is not required.
The source system requires write permissions for the directory in which the synchronization files are created.
The target system requires read permissions for the directory in which the synchronization files are created.
Storage capacity:
To prevent the synchronization files from filling the storage, sufficient space must be available.
Under standard conditions, about 20 MB per device and data class per day is typical because most data is synchronized at a 10-minute resolution.
In addition, approximately 960 files are created per day for each device and data class. This should be considered during storage planning.
File management:
Old files are currently not deleted automatically. Therefore, free space should be checked regularly.
Old files can be removed by a cron job or comparable mechanism after the target system has imported them.
Data Synchronization (OT / IT Bridge) is configured via the administration interface of the WebPQ instance. The settings for export and import can be configured there separately. It is also possible to filter the selection of devices using a regular expression so that, for example, only specific devices are synchronized.
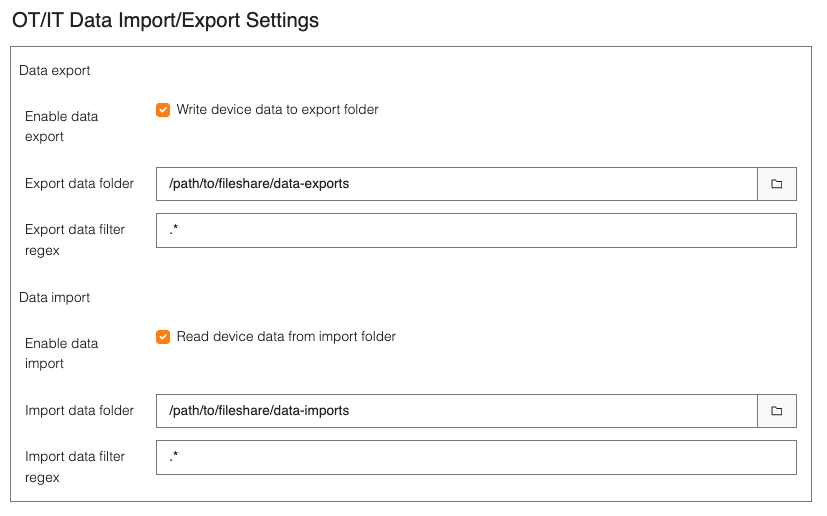
To make selecting the devices to be synchronized easier, regular expressions can be used. For example, the regular
expression .* can be used to synchronize all devices, or Plant.* can be used to synchronize only devices whose
name begins with "Plant".
Attention: The screenshot is provided only to illustrate the Data Synchronization (OT / IT Bridge) settings. Exporting and importing data at the same time on the same WebPQ instance is not possible, because the devices are detected there as already existing and the synchronization does not start. Therefore, it is important to set up synchronization on two different WebPQ instances in order to ensure that the functionality works correctly.
Data Synchronization (OT / IT Bridge) is a special feature that is generally not included in the standard license. It requires a separate license because it involves additional resources and maintenance effort. Measurement data synchronization will only start if a valid license for this feature is available. Without the corresponding license, the synchronization processes will not start and no data will be synchronized.
For operating the OT/IT bridge, the license WebPQ Add on Second Instance-OT/IT Bridge with article number L.900.9265.39 must be available. This license prerequisite should be verified for the WebPQ instances involved so that data-sync export and import are enabled technically.
The status of Data Synchronization (OT / IT Bridge) on the source system can be monitored using log files that contain information about possible errors. If export is not possible - for example because the file system is full - this is recorded in the log file as a syslog message. It is therefore important to check the log files regularly in order to ensure that the synchronization works smoothly and to detect possible problems at an early stage.
In practice, it is useful to distinguish between syslog events and log files:
Syslog inside WebPQ: The functional synchronization messages appear in the WebPQ syslog view. This is where configuration issues, license issues, and import failures are typically easiest to see.
Standard server log files: In addition, WebPQ writes server logs to the configured standard log folder. In a default installation, this folder is located at %PROGRAMDATA%\aeberle\logs\services, unless the instance uses a custom persistent data path.
Audit logs: If needed, audit log files are stored separately under %PROGRAMDATA%\aeberle\logs\audit.
In the Electron desktop application, an administrator can open these folders directly from the syslog page. In the browser, the log files can be downloaded there as a ZIP archive. For OT/IT bridge troubleshooting, the syslog inside WebPQ is usually the most important first stop.
On the target system, the synchronization status can be viewed on the "Device Synchronization" page in the "Import / Export" section. The current synchronization status is displayed there, including information about the last synchronized files and possible errors. Further details on the synchronization status can be found in the documentation under Synchronization Status. Syslog messages are also logged on the target system if import is not possible - for example because the files cannot be read or because the database has changed and is no longer in the same state as during export. Therefore, it is also important on the target system to check the log files regularly in order to ensure that synchronization works smoothly and to detect possible problems at an early stage.
The status page is refreshed regularly. It shows whether synchronization is active for a device, whether errors are present, when the latest synchronized data point arrived, and whether files are currently still waiting in the upload queue.
Export is triggered directly from the measurement-data write path. WebPQ therefore writes the sync files only after the corresponding block of data has been stored successfully in the OT database. This ensures that the exported file is always based on a consistent data state.
The import process works in two cycles: every 15 minutes, it looks for new device-data-class combinations in the import folder. For combinations that are already known, WebPQ then checks every 10 seconds whether the next expected file is present. Only files that have already been written completely and finalized are imported.
The meaning of the file types is important:
.full.aed replaces the previous data set on the target system for the affected device-data-class combination.
.historical.aed adds missing historical data without deleting existing data first.
.aed is the normal incremental runtime format.
All devices created automatically by synchronization receive the tag syncimport so that they can easily be distinguished from other devices. This tag can be removed or changed later if it is not needed.
Check the following points in order:
Verify that data synchronization is licensed on the source and target tenant. Without the DataSync feature, export or import remains disabled and no files are processed. For the OT/IT bridge, this includes the license WebPQ Add on Second Instance-OT/IT Bridge with article number L.900.9265.39.
Verify that the configured export folder on the source system and the import folder on the target system really exist and are directories.
Verify that the source system has write permissions and the target system has read permissions for the shared folders.
Verify that the source and target systems are two different WebPQ instances. Import and export on the same instance is not the supported setup for this workflow.
Verify that the configured device filter regular expression actually matches the expected device names.
Check the Device Synchronization page on the target system and the Syslog on both systems.
The page gives the fastest overview of whether the target system is still catching up or whether it is blocked:
Active indicates whether synchronization is currently running for the device.
Errors shows whether the device has a current synchronization problem.
Latest synced data point shows how recent the imported data is.
A yellow or red latest-data indicator means the imported data is older than expected.
The queue banner above the table shows how many files are currently being processed and how many are still waiting.
If the queue warning stays visible for a long time, this points to a backlog in database upload processing on the target system.
The code paths for synchronization write explicit operational messages for several important failure cases:
The configured export folder is not a directory: export is disabled.
The configured import folder is not a directory: import is disabled.
The temporary folder for sync export cannot be created.
A file cannot be written on the source system.
A sync file cannot be imported on the target system.
The DataSync license feature is missing for export or import.
These messages are written to the Syslog and should be checked first when synchronization stops unexpectedly.
Examples of actual messages from the implementation are:
The configured import folder at path <path> is not a directory. Import is disabled.
The configured export folder '<path>' does not exist or is not a directory. Data export is disabled.
DataSync feature is not enabled for tenant <tenant>. Data Import is disabled for device <deviceName>.
Error importing file for device <deviceName> at path <file>. Error: <errorText>
When such messages appear, the first checks should be the configured folders, permissions, license status, and file readability.
For the OT/IT bridge, not through the normal export/import configuration. The current behavior is fixed as follows:
New device-data-class combinations are discovered every 15 minutes.
Known combinations are checked every 10 seconds for the next expected file.
At the moment, the OT/IT bridge exposes only these settings in the user/admin interface:
Export enabled / Import enabled
Export and import folders
Regex filter for device names
Export compression
This should not be confused with device synchronization between a measuring device and the WebPQ server. Those intervals can be adjusted administratively in the instance settings and are described on 6_6_4_synch.md. Changing those settings does not change the 15-minute or 10-second OT/IT bridge file-processing cycles.
Depending on the use case, in two places:
WebPQ syslog inside the application
The functional OT/IT bridge messages are shown in the application's syslog view. For first-level troubleshooting, this is usually more useful than raw file logs.
Standard server log files
By default under %PROGRAMDATA%\aeberle\logs\services. If the instance uses a different persistent data path, the effective path is <persistentDataPath>\logs\services.
Audit log files
By default under %PROGRAMDATA%\aeberle\logs\audit, or under <persistentDataPath>\logs\audit if a custom persistent data path is configured.
From the syslog page, an administrator can open these folders directly in the desktop application or download their contents as a ZIP archive in the browser.
Open the device in Import / Export > Device Synchronization and inspect the detail view:
The DB Sync Details section shows the current error text per data class.
A data class can enter the state Blocked by error if the last file for that class could not be imported.
In that case, select the affected data class row and use Download files again to schedule a re-download of the failed file and the following files.
This is the intended recovery path when the target system knows which data class is blocked and the source files are still available.
If the synchronization page shows many files waiting in the upload queue for a longer period, this indicates that the target system is importing slower than files arrive. In this case:
Check whether the warning about too many files in queue remains visible.
Check the Syslog for repeated import errors.
Check whether storage, database performance, or administrative limits are slowing down the upload pipeline.
If necessary, ask an administrator to review the system setting for maxParallelUploads.
The target system scans the import directory periodically for new device-data-class combinations and then continues to check for the next expected file. Because of this behavior, the following points matter:
New device or data-class folders may not appear immediately in the status page because the scan cycle is periodic.
Only files for device names matching the configured regex filter are considered.
Incomplete or unreadable files are not imported successfully and lead to error entries instead.
Devices created automatically by the synchronization import receive the tag syncimport. This makes it easier to recognize imported devices during troubleshooting.
All reports generated by users as PDFs can be found in the "Import / Export >> Print" section. Here you can view, download, and manage the reports.
Reports generated through the following functions can be found there:
Manual creation of a report from the analysis cockpit
Automatic creation of reports from automation tasks
The PDF files are stored on the server in the directory specified in the WebPQ backend. On the client, the reports are displayed in a table containing the following information:
| Title | Type | Time | Actions |
|---|---|---|---|
| Name of the report | Type of report (e.g., automation task) | Time of report creation | Download the report |
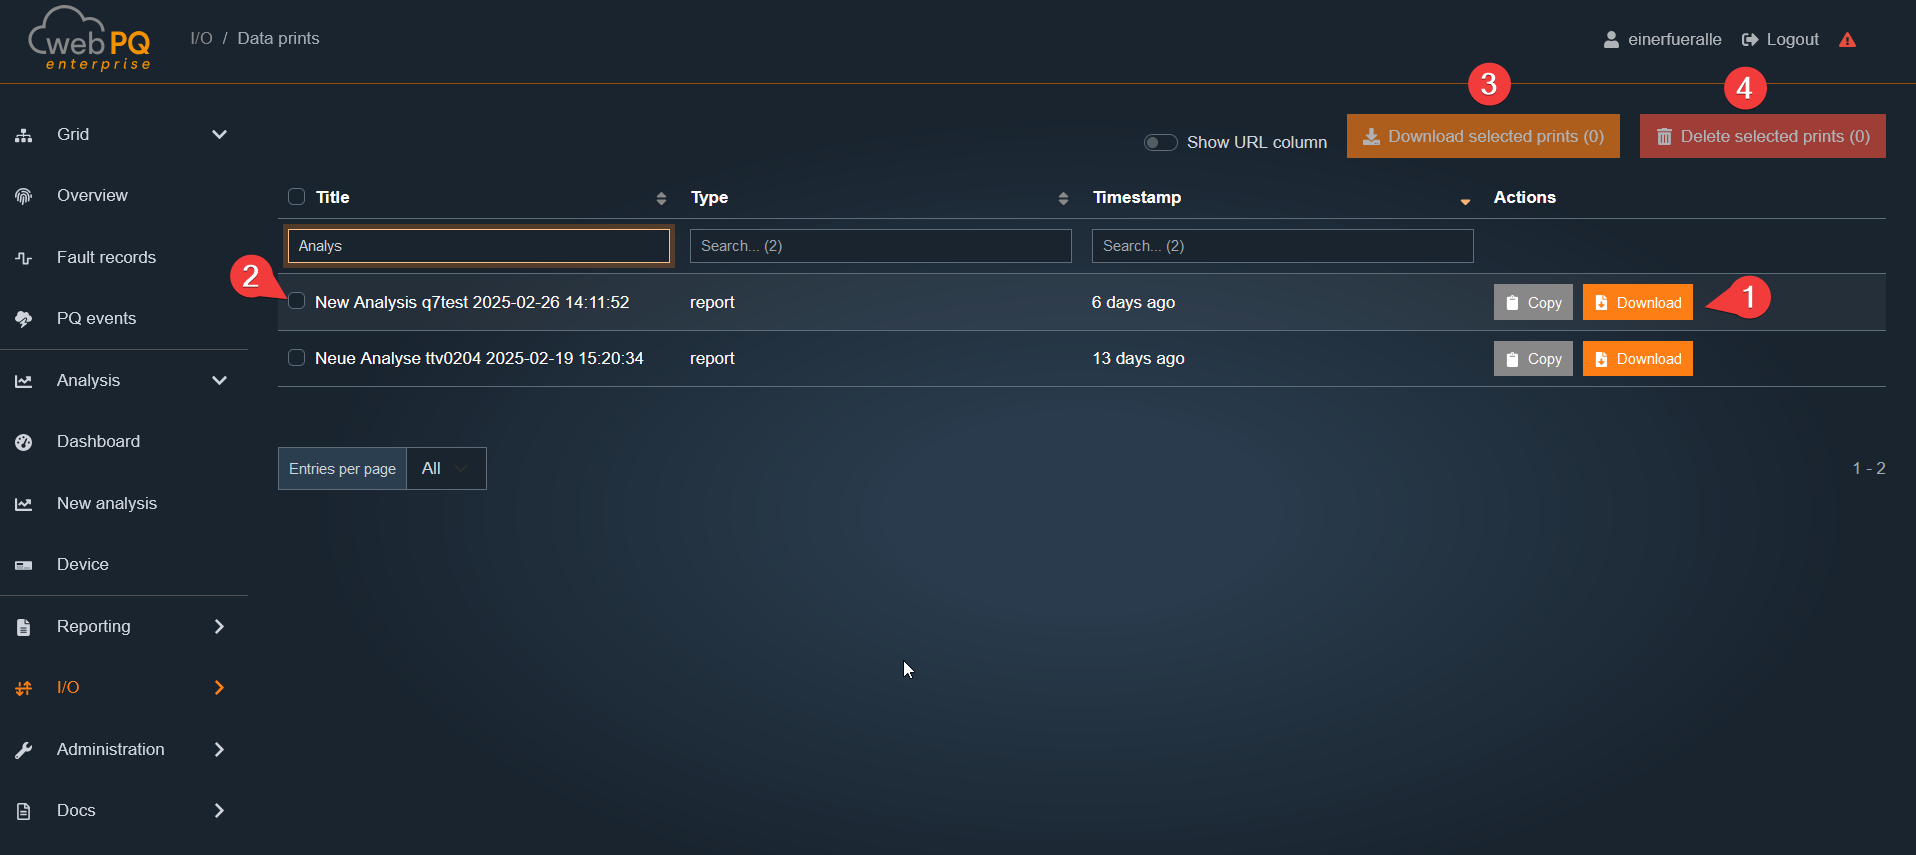
By downloading the report #1, the user has the option to download the PDF from the server and save it locally.
With #2, the user can select multiple reports. Via #3, the user can either download multiple reports in parallel or delete multiple reports via #4.
Measuring devices that are continuously read out automatically by the database software are displayed in the "Import / Export" section under "Device Synchronization".
The exact status of the synchronization is shown there.
The page displays the following information, which can be expanded with details for a measuring device by clicking on #1. Additionally, a hierarchical view can be selected via #2. The table itself contains the following information:
| Device Name | Regular Synchronization | Active | Current Error Status |
|---|---|---|---|
| Name of the device, including tag display | Indicates whether the device has been enabled for regular synchronization in the settings | Shows the current status | Displays the current error status |
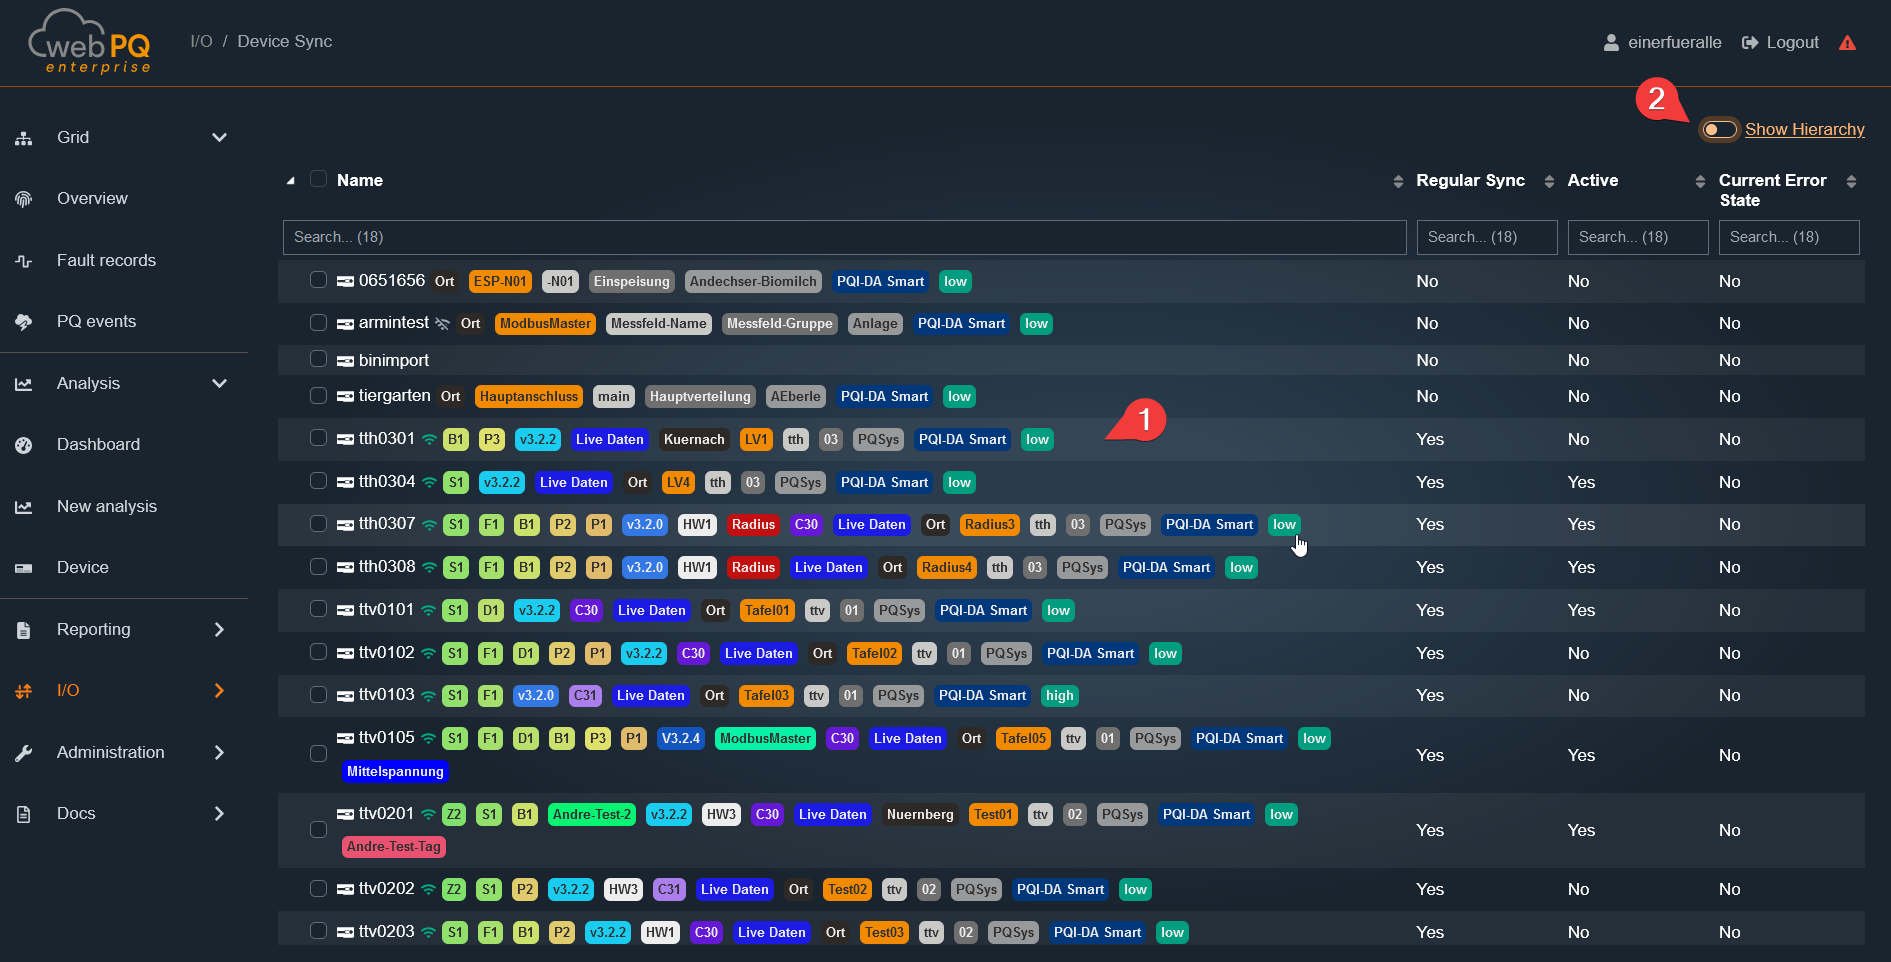
Device synchronization displays the download status from the device to the server. In addition to the current synchronization status, such as "Inactive", the following information is also shown:
The last transmission rate
The current file being downloaded
All pending files to be downloaded
If, for example, there is a connection issue with the measuring device, this error will be displayed under "Device Synchronization Error".
Database synchronization shows the upload status from the WebPQ instance to the database. Here, the individual data classes are listed, along with the files that were last uploaded to the database. The section "End timestamp for the most recent file" displays the timestamp recorded as the last measurement point in the most recently uploaded file.
Additionally, users have the option to selectively check data classes to see which data was last uploaded to the database.
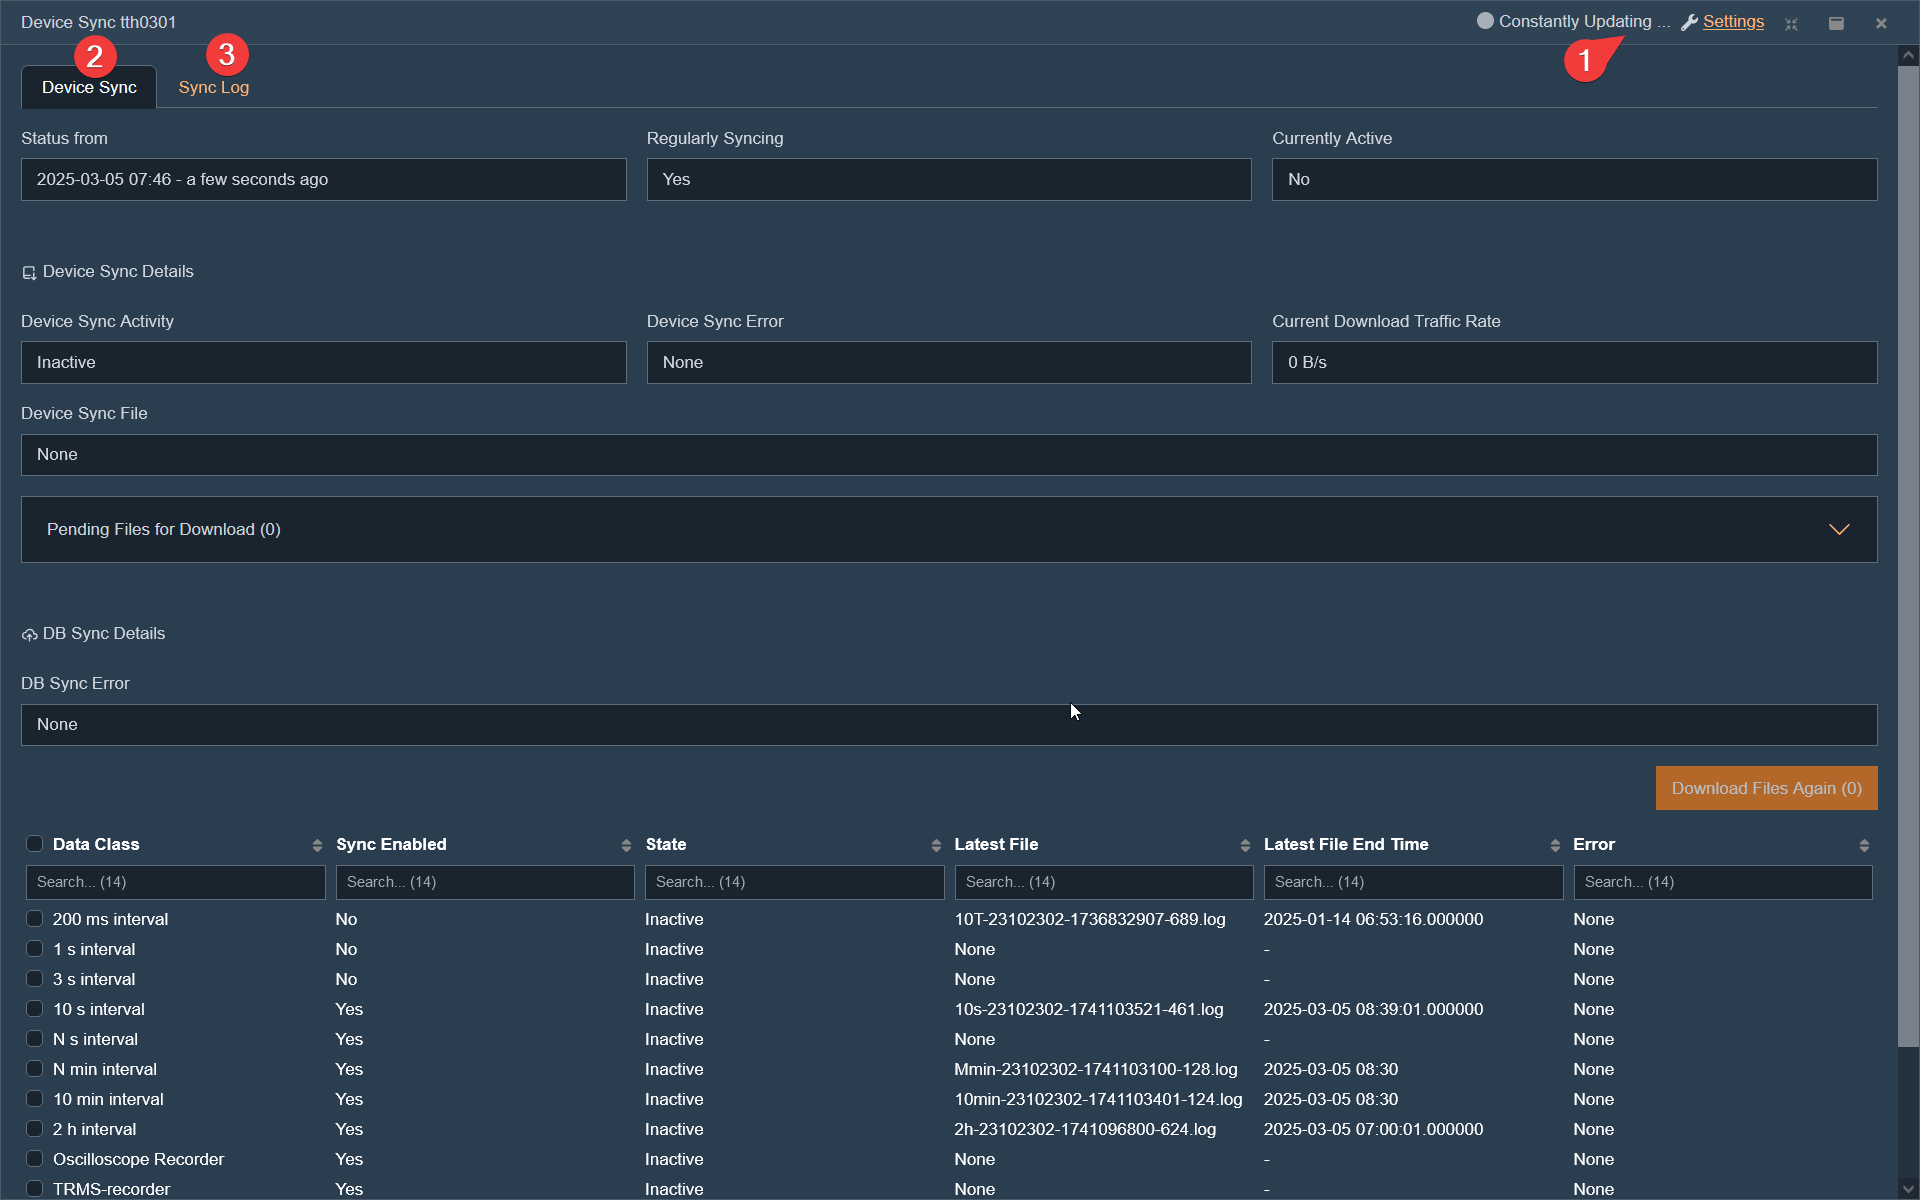
If the user wants to change the settings for a measuring point, he can directly switch to the configuration of the measuring point by clicking on Settings #1. Additionally, #3 allows for expanded logging to obtain more information. This function is sometimes used in the support area upon request.
Automatic device synchronization checks active devices repeatedly. A quick check normally runs every 30 seconds. A more thorough check normally runs every second quick-check cycle, so with the standard settings it runs about every 60 seconds. These intervals are configured by the system administrator in the WebPQ instance settings.
When several data classes are waiting for download or upload at the same time, WebPQ processes them by data-class priority. Fault recorder and long-term classes are prioritized before lower-priority classes. This helps important disturbance and EN 50160 data arrive before less urgent data when a device or database has a larger backlog.
Through the Device Management, devices can be viewed, added, managed, and deleted.
The interface is divided into three sections:
Add and delete devices
Tabular and hierarchical representation of all existing devices
Detailed device view, which is displayed after clicking on a device under #5
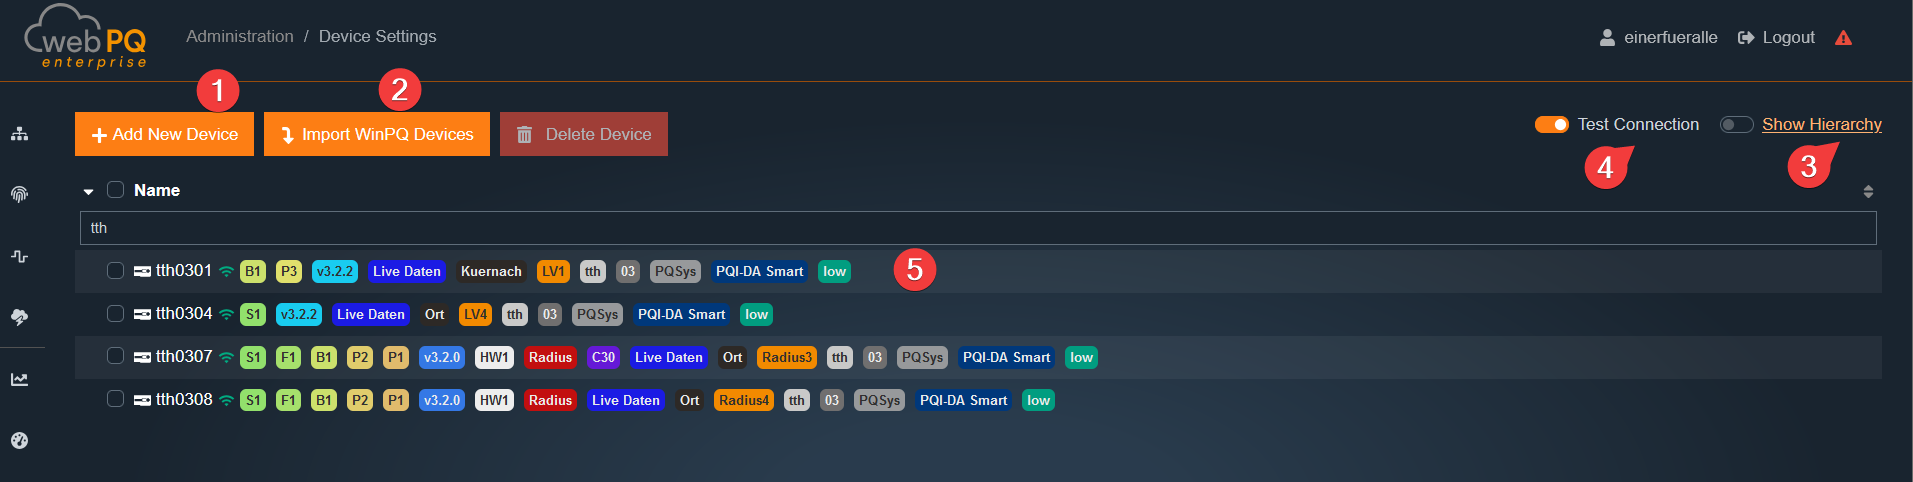
"+ Add new device" #1 –
Creates a new device through a guided wizard.
"+ Import from WinPQ" #2 –
Imports PQI-DA smart, PQI-LV, and PQI-DE from WinPQ into WebPQ through a wizard.
"Delete device" –
Deletes one or more selected devices through a background job.
All measurement data, parameters, and settings are removed from the database.
All functions require the permission "Create and delete devices",
which is configured in the rights management at the user group level.
Additional Functions
Test connection #4 –
Continuously checks the active connection of all devices.
If a connection is present, a symbol appears under #5 directly on the device.
Show hierarchy #5 –
Displays the devices in the hierarchical structure of the default settings.
The user can customize categories individually through drag & drop.
Changes remain saved for the duration of the login.
Operation with WinPQ in parallel mode
When the WebPQ software is operated together with the WinPQ software, the following measuring devices are automatically transferred from WinPQ to WebPQ after installation. An automated synchronization occurs in the background every 60 seconds. These devices are then added to the user group root_default_users, root_default_operators, root_default_administrators, and the root tenant.
PQI-DA
PQI-D UU (Voltage / Voltage)
PQI-D UI (Voltage / Current)
PQ-Boxes
For these measuring devices, WebPQ serves as a pure visualization solution based on the measurement data read out and stored in WinPQ via the PQ Manager process.
For the device generations PQI-LV, PQI-DA smart, and PQI-DE, which are used in parallel operation with WinPQ, the process of transferring the communication layer from WinPQ to WebPQ is partially automated. This can be done via the button +Import from WinPQ.
PQI-D devices are added with the same + Add new device wizard as other measuring devices. The PQI-D workflow differs from PQI-DA smart, PQI-LV, and PQI-DE because WebPQ first connects to the PQI-D communication endpoint and detects the measuring devices that are available behind that connection.
PQI-D device creation is available only when WebPQ runs on a Windows server. On other server operating systems, the PQI-D device types are hidden in the device type selection.
To add a PQI-D device:
Open Administration > Devices.
Select + Add new device.
Select PQI-D UI or PQI-D UU as the device type.
Select the device time zone and tenant.
Enter the PQI-D connection data:
Host: IP address or host name of the PQI-D communication endpoint.
Port: external communication port.
Internal Port: local port used by WebPQ for the internal PQI-D connection.
Click Get Devices.
Select the detected devices that should be created in WebPQ.
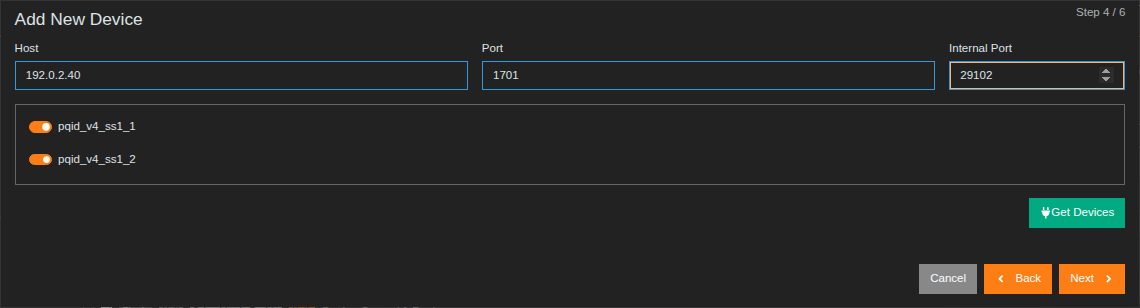
After the devices have been detected, choose the data classes that WebPQ should read automatically. WebPQ preselects the data classes needed for EN 50160 evaluation. The Active switch controls whether the automatic data download is active for the detected device.
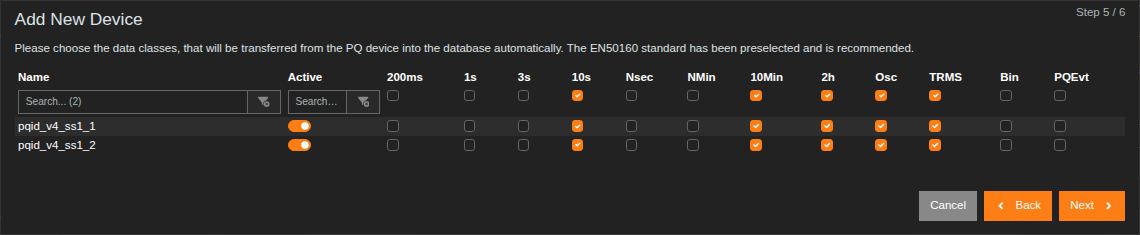
When a PQI-D UU device exposes two voltage systems, WebPQ creates the related subdevices from the detected device list. For license counting, the related PQI-D UU pair is treated as one device unit.
The Import WinPQ Devices wizard is intended for systems that already contain devices in a WinPQ installation. It imports the device metadata into WebPQ and supports the transfer of PQI-DA smart, PQI-LV, PQI-DE, and PQI-D devices where the communication layer can be moved into WebPQ.
Use this wizard when devices already exist in WinPQ and should be managed or read directly by WebPQ. After the import, review the detected devices before creating them. Device names, connection settings, and data classes should be checked carefully because they determine how WebPQ stores the imported measurement data and how the devices appear in analyses, exports, and dashboards.
COMTRADE imports use WebPQ devices of type Comtrade. This device type is available only when the COMTRADE import add-on is enabled in the license.
A COMTRADE device stores the target channel mapping used by the import wizard. The mapping links channel names from the COMTRADE configuration file to WebPQ data classes and data types. Check the time zone and channel mapping before running regular imports from the same source, because the settings are reused when matching COMTRADE files are imported again.
When the detail window is opened by clicking on one or more selected devices in the selection field, the detailed settings of the devices appear.
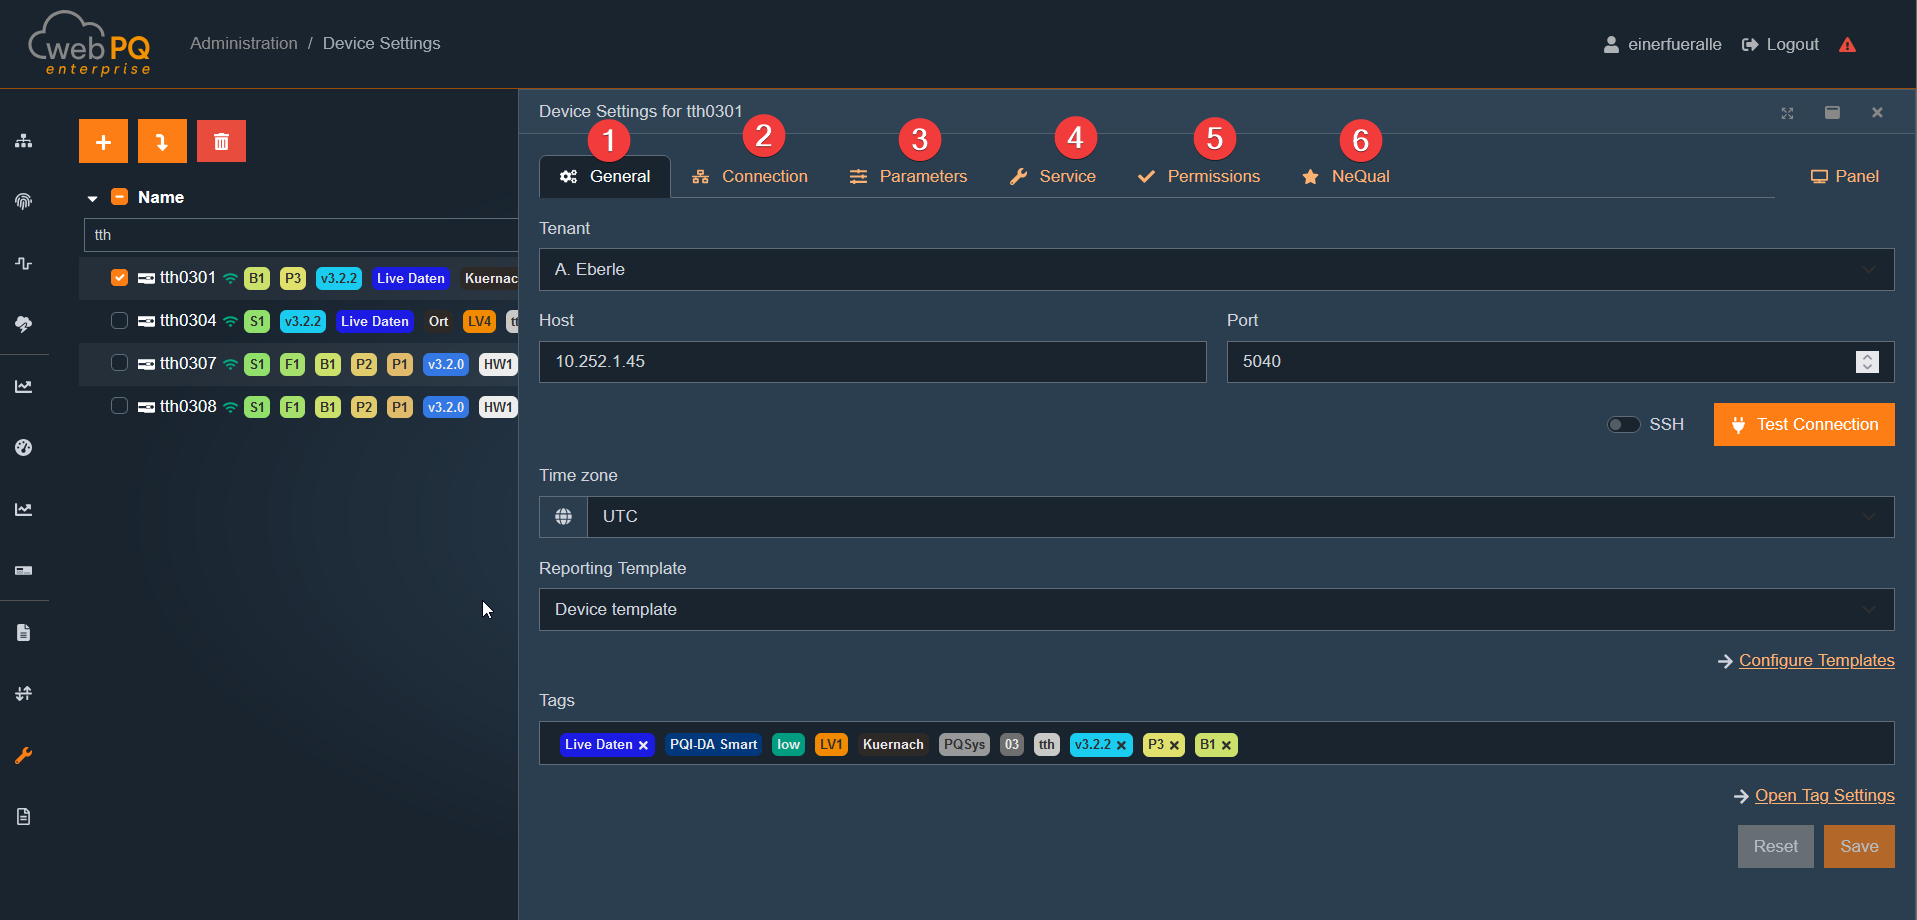
General #1
In the General section, the most important parameters such as IP address, device time zone, and the assignment of tags and standard templates to the measuring point can be configured.
Connection #2
In the Connection section, in addition to the IP address, the settings for the automatic data class readout process can be managed and their activation and deactivation controlled.
When multiple devices are selected in parallel via the device tree, the tabular and searchable representation allows for quick parameterization and comparison of many devices.
Parameter #3
In the Parameter section, the measuring device parameters can be individually adjusted. This allows the measuring devices to be centrally parameterized directly via the web interface.
All parameters are historized in the database. Various parameter editors allow the application of parameter templates to devices, editing of individual parameters, and importing and exporting parameters – either directly to the measuring device or to the local file system.
Service #4
In the Service section, all functions necessary for device service are summarized. These include, among others:
Reading device log files and audit log files
Firmware updates for the devices
Rights #5
In the Rights section, the effective permissions of users for the respective devices can be viewed via rights management and group policies.
NeQual #6
If licensed, the NeQual section allows the configuration of settings for the NEQUAL export once per measuring point.
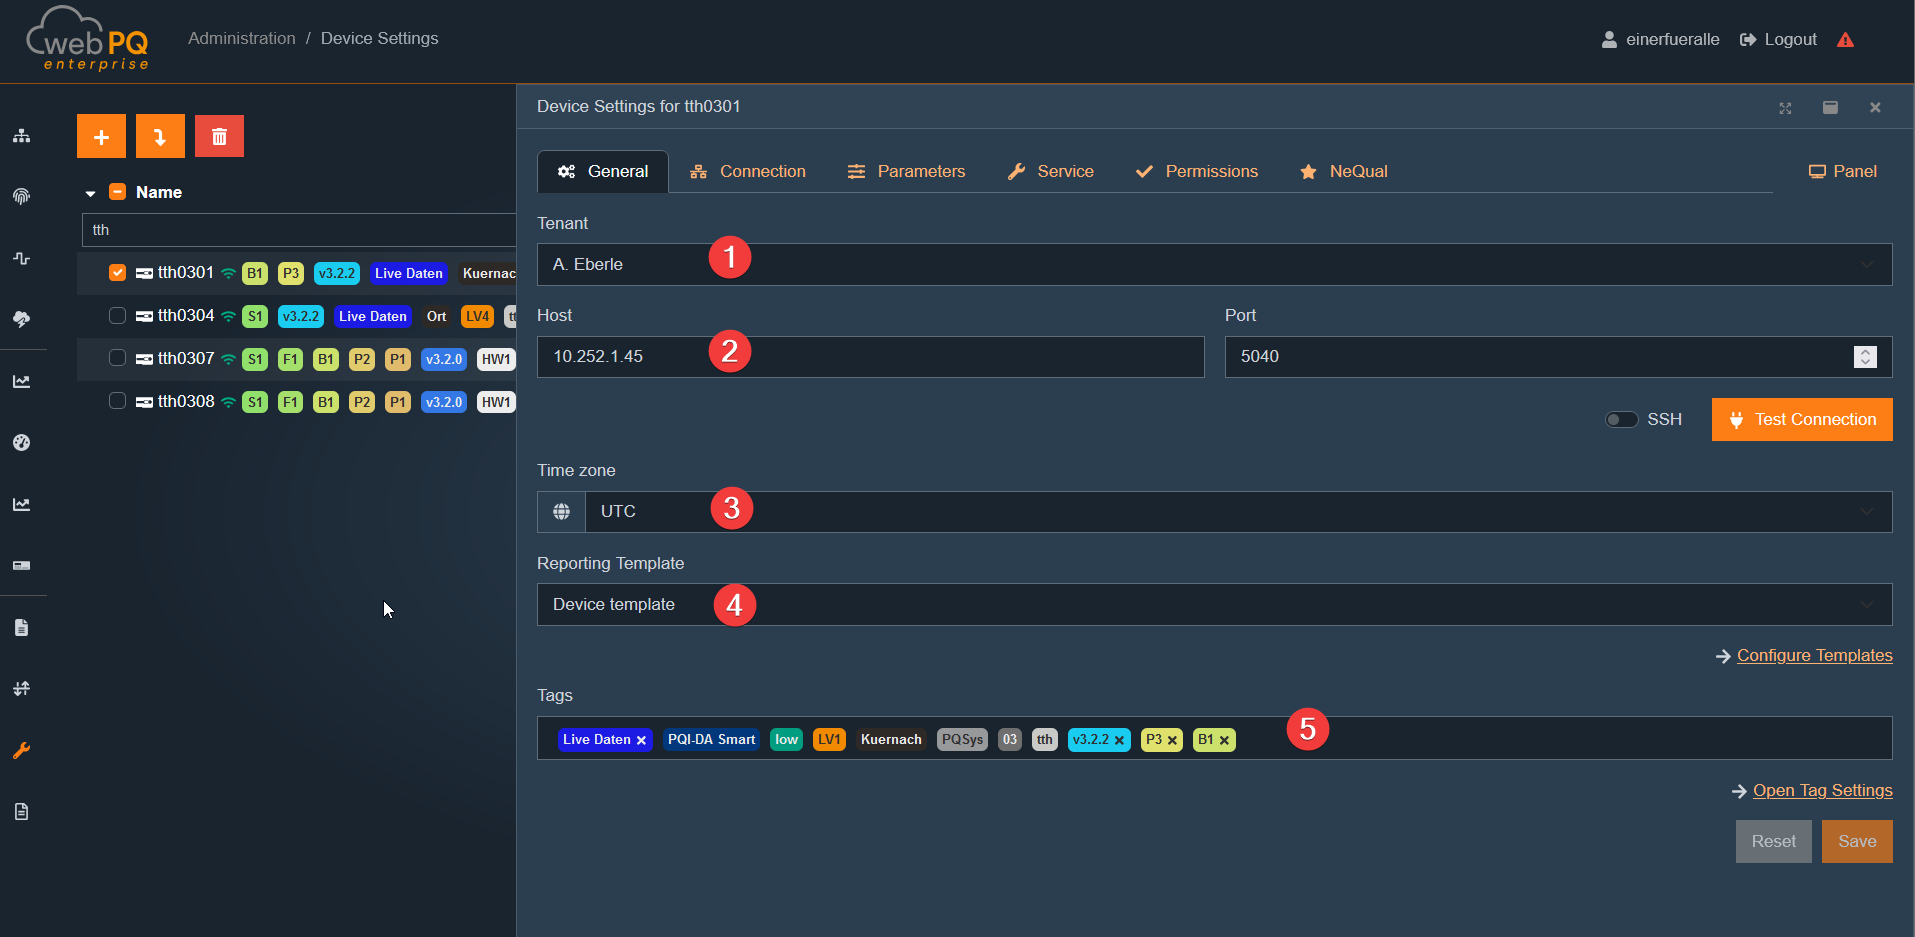
#1 Tenant – Each device can be assigned to its own tenant.
Device name – WebPQ validates the device name before the settings can be saved.
For most device types, only lowercase letters and digits are allowed, with a length of 2 to 12 characters.
PQI-D UI, PQI-D UU, and Modbus client devices may additionally use a trailing qualifier such as _1. For these device types, WebPQ allows up to 15 characters.
The Save button becomes available only after at least one value was changed and all required fields are valid.
#2 Host and Port – Each device requires an IP address and a port that must be accessible from the WebPQ server.
For the devices PQI-DA smart, PQI-DE, and PQI-LV, port 5040 is to be used.
If the devices are connected via SSH (encrypted), port 22 is to be used.
The communication from the server to the device can be tested via Test connection.
If the test is successful, the button changes from orange to green.
WebPQ only enables Test connection while the current form data is valid. Invalid host, port, or required metadata entries must be corrected first.
#3 Time Zone – Each device can be assigned a time zone in the software.
All measuring devices deliver the measurement data in UTC to the database.
Therefore, the respective measuring point must be equipped with the locally valid time zone.
This parameter affects all reports and analyses in the system.
When the time zone is changed for device types with time-zone support, WebPQ asks whether existing statistics should be recalculated before the change is saved.
#4 Standard Templates – By default, the settings of the measuring device itself are used for the calculation of statistical standard limit values.
The standard template is loaded into the database after the first contact with the measuring device.
However, the user can also apply other standard templates to the measuring point.
These standard templates are managed in the Standard Templates section and can be accessed via the link.
#5 Tags – After the first reading of the measurement data, each device is automatically equipped with so-called tags.
Tags are the basis for labeling and hierarchical representation in all selection dialogs and tables.
Clicking on the area displays all existing tags of the tenant.
Clicking on a tag assigns it to the device.
The Open tag settings button leads to the area where tags and categories can be added.
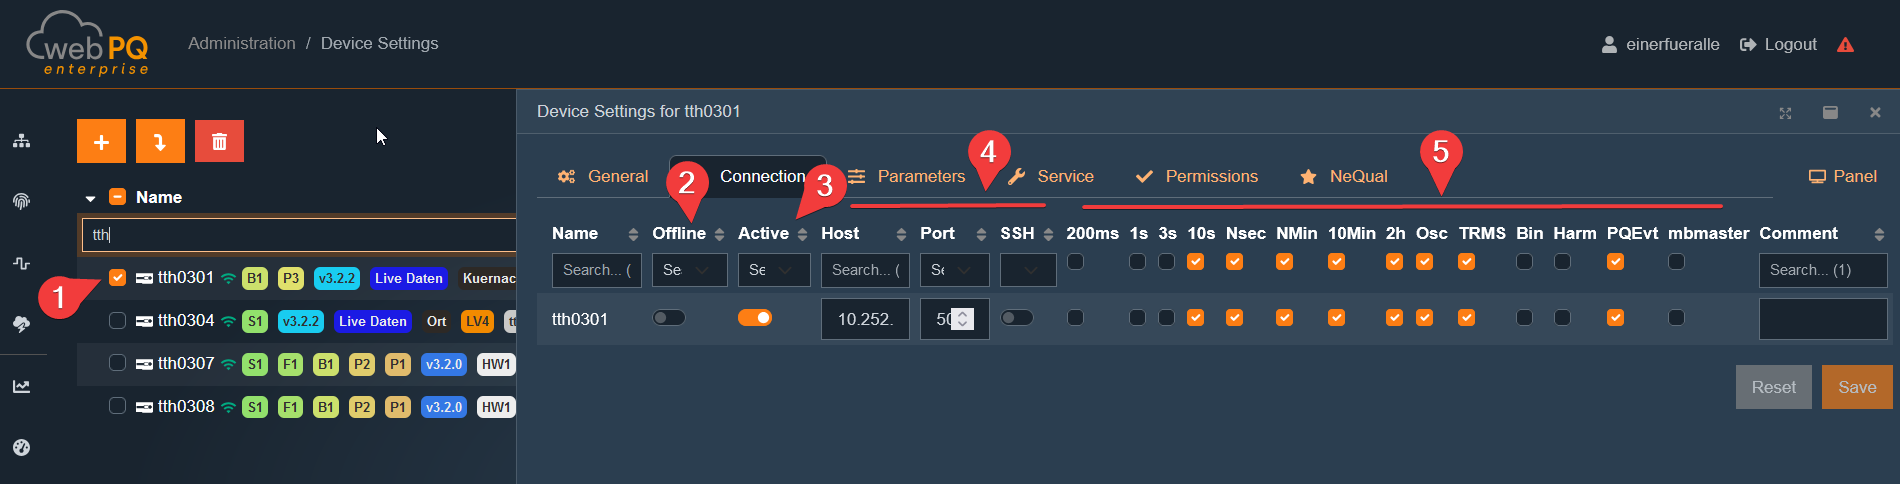
#1 Multiple Selection – The user can select multiple devices in parallel.
This is particularly advantageous when comparing settings between devices or aligning general device settings.
#2 Offline – Measuring devices that are operated without direct TCP/IP communication (e.g., through manual file imports via SD cards) must be configured as offline devices.
Offline devices are automatically hidden from the live displays of measurement values.
#3 Active – Devices that are to be automatically read out by the system with the set data classes must be set as active here.
If a device is taken out of service and should no longer be read out, the flag can be deactivated.
#4 Host & Port & SSH – Specification of the IP address and port used for communication between the server and the measuring device.
Standard ports for the devices PQI-LV, PQI-DA smart, and PQI-DE:
Port 5040 for communication via CCCI (default).
Port 22 for encrypted communication via SSH (with user rights management).
For SSH connections, the SSH option must also be activated in the corresponding column.
#5 Data Classes – Here, the data classes are defined that are to be automatically retrieved from the measuring device and stored in the database.
Important: On the measuring devices themselves, the desired measurement variables in the respective data classes must be activated in the recording parameters.
For slave devices connected to measuring devices via the P3 feature, the mbMaster must always be activated.
PQ-Box and PQI devices use a shared WebPQ data-class model. PQ-Box files are mapped to the corresponding WebPQ data classes during import, so the same data-class names are used later in analyses and exports.
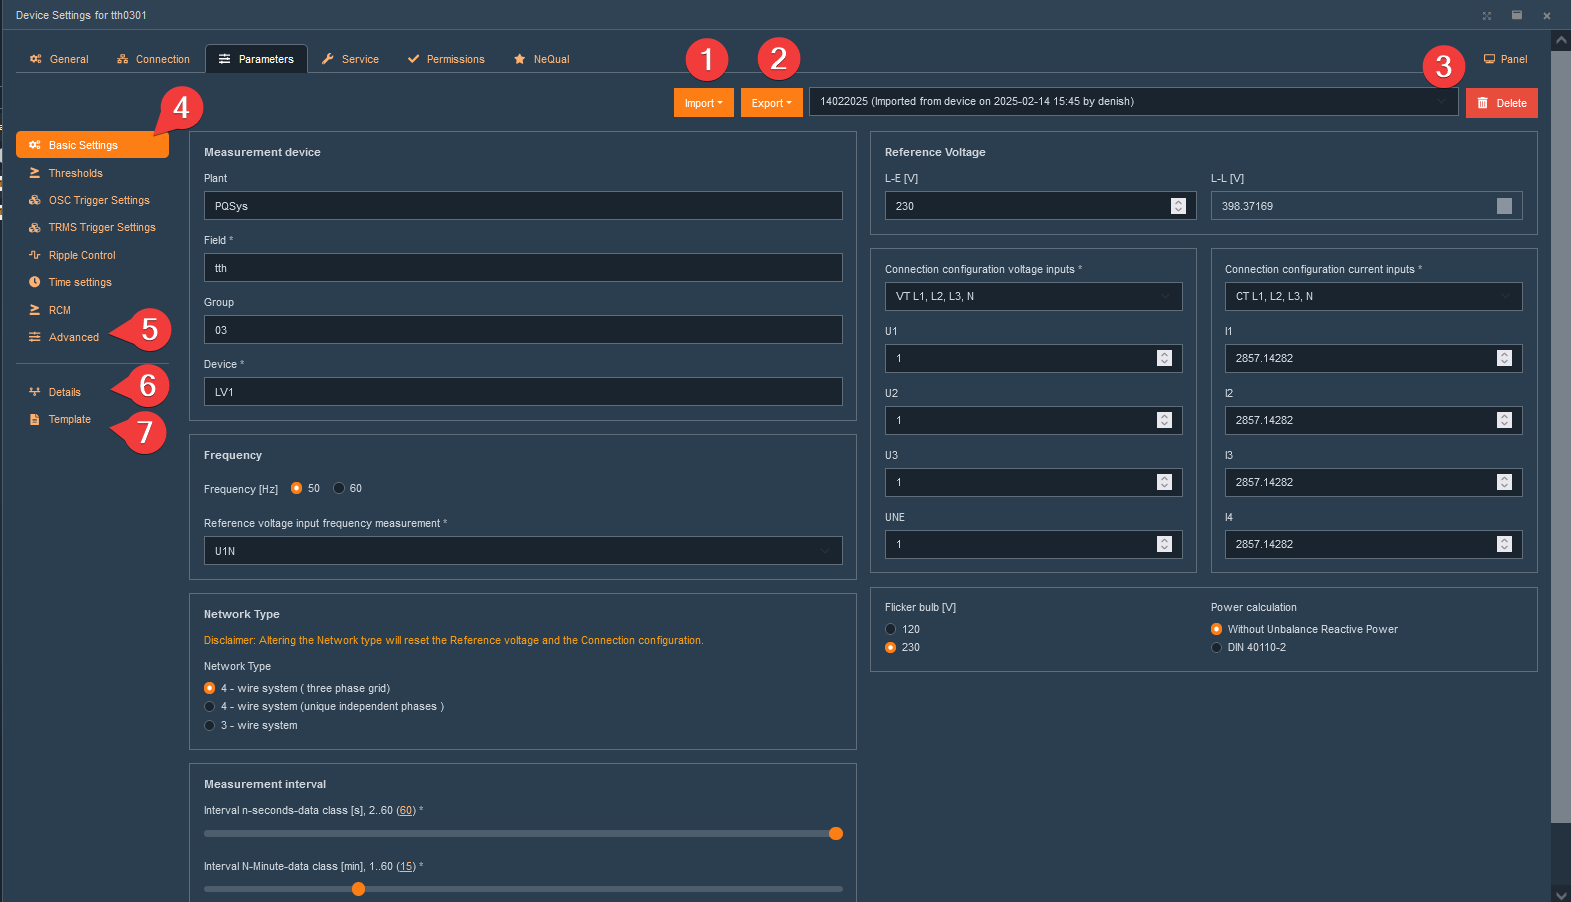
Two parameterization paths:
Directly in WebPQ (PQI-DA smart, PQI-DE, PQI-LV):
Fully supported natively in WebPQ, including parameter management and historization.
Via ParaExpress software (classic-platform devices such as PQI-D UI, PQI-D UU):
Available starting with version 2.2, on Windows only.
Requires a local installation of the ParaExpress software through a link provided by the server.
WebPQ starts ParaExpress with the matching device configuration through a server-provided port and forwards the connection to the device into the ParaExpress software.
#1 Import – The import function allows parameter files to be loaded either directly from the device or from the local file system as XML or * .aepq file.
Read from device:
Establishes a connection to the device and saves the parameterization in the database.
If the device has URM with RBAC (user management), credentials are required.
Open from file:
The user can select an XML file or other supported file formats.
If the parameter set contains references to additional files (e.g., certificates for WireGuard or the web server), the user is prompted to add them.
A parameter set typically consists of the following components:
General parameters (XML parameter file, depending on the measuring device).
External parameters, e.g.:
IEC61850 ICD file
Certificates for the web server
Certificates for the WireGuard connection
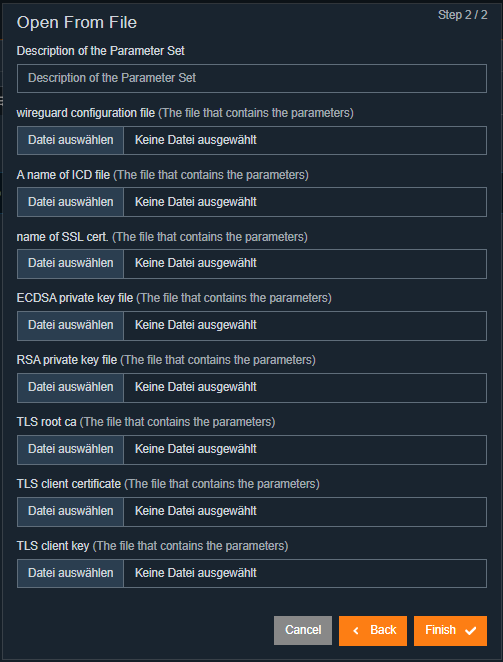
#2 Export – The export function allows parameter files to be sent either to the measuring device or saved in standard formats on the client.
"Send to device":
The selected parameter template is transferred to the device.
Before sending, the current device configuration is loaded to display the differences between the old and new template. This ensures that only desired changes are transferred.
"Send to fleet"(license required):
Forwards the parameter template to fleet management.
Opens the dialog for sending to multiple devices.
"Save file":
Saves the file as a .aepq file on the local file system.
"Export as CSV file":
Creates a CSV file from the parameters.
#3 Parameter Historization – Here, the user can historically view and compare imported parameter files.
The history includes both imports from files and imports directly from the measuring device.
Each import is logged with time and user who loaded the file into the database.
Each parameter file can also be historized manually.
Changes to the parameters and their historization are displayed under #6.
#4 Device Parameter View – simplified –
The simplified view of the parameterization offers a fixed structure with predefined masks for the most important settings.
The individual settings can be set directly via the input masks and are divided into the following areas:
Basic settings – Name and transformer settings of the measuring device
Limit values – Used for PQ standard evaluation
OSC and TRMS trigger settings – Settings for limit values and duration of the disturbance recorder
Time settings – Configuration of time synchronization, e.g., via a central NTP server
Differential current – Settings for differential current measurement on the PQI-DE device
Note:
Detailed information on device settings can be found in the respective user manuals of the measuring devices.
The available simplified editors depend on the selected WebPQ device type and on the parameter set that was loaded. For example, PQ Smart devices expose dedicated editors for basic settings, thresholds, trigger settings, time settings, network settings, SCADA, and residual current monitoring, while unsupported sections stay hidden.
The editors are schema-driven. Required fields, valid value ranges, and option-dependent sub-sections are taken from the loaded parameter schema. Depending on the selected option, WebPQ can therefore show or hide additional fields dynamically.
Saving and exporting parameter changes follows strict validation rules:
Reset is only available after parameters were changed.
Save is only available after parameters were changed and all visible parameter editors are valid.
If invalid parameter values remain, WebPQ shows an error summary and blocks saving as well as exports that require a valid parameter set.
Parameter import is also validation-aware:
Read from device first verifies the device connection and then stores the downloaded parameter set in the WebPQ history.
Open from file creates a new historized parameter set from the selected file.
If a PQ Smart parameter archive references additional files such as ICD files or certificates, the import wizard asks for those files before the parameter set is stored.
In the PQ Smart Basic settings editor, some values are recalculated together:
Changing the network type resets the relevant reference-voltage defaults and transformer correction factors.
Transformer correction factors are normalized from the entered values. When the derived nominal values would violate the device constraints, WebPQ highlights the corrected target values and blocks saving until the remaining constraint violation is resolved.
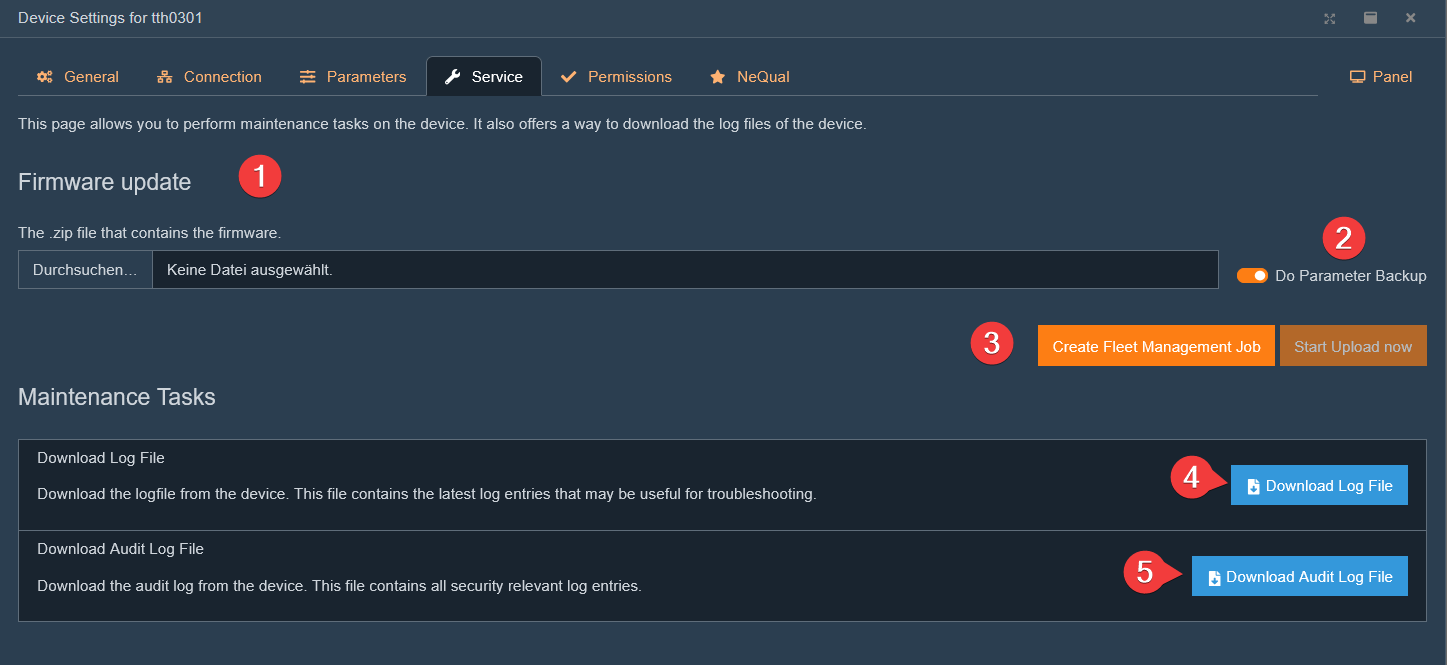
#1 Firmware Update – This function allows the firmware of the measuring devices to be updated centrally from the server.
Both the measuring devices and WebPQ require the corresponding right for the firmware update.
Before the update, the current parameterization of the device can be backed up under #2.
With an existing Fleet Management license (#3), multiple measuring devices can be updated in parallel.
#4 Load Debug Log –
Downloads the debug log from the device.
Contains the latest log entries useful for troubleshooting and support cases.
#5 Load Audit Log –
Downloads the audit log from the device.
Contains all security-relevant log entries.
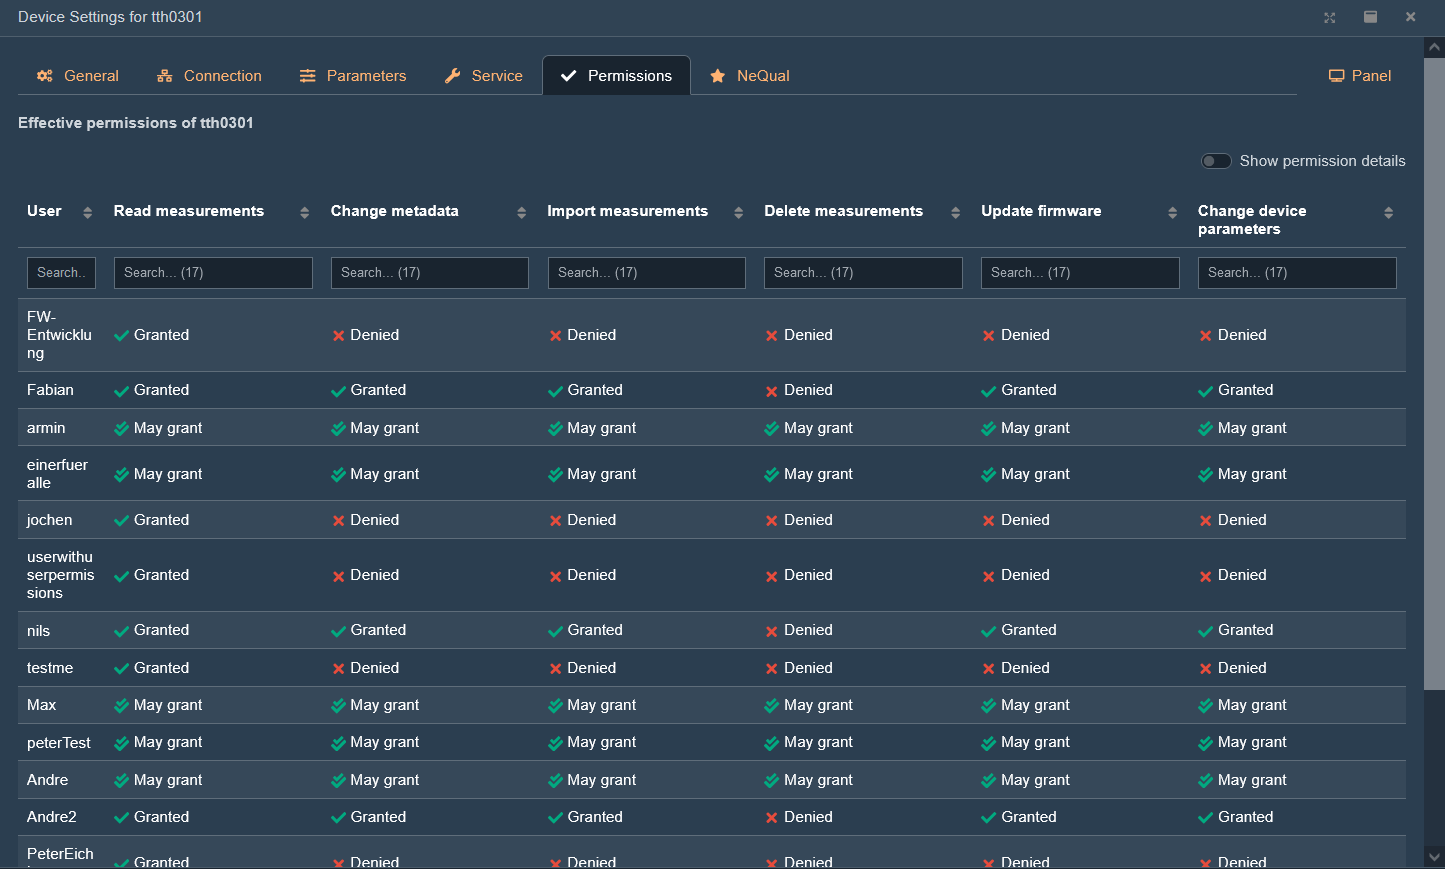
In this tabular display, all users with rights on the device are shown – including:
Assigned rights
Permission details (viewable via the button)
The settings for user rights on devices are made via:
User groups
Tenant management
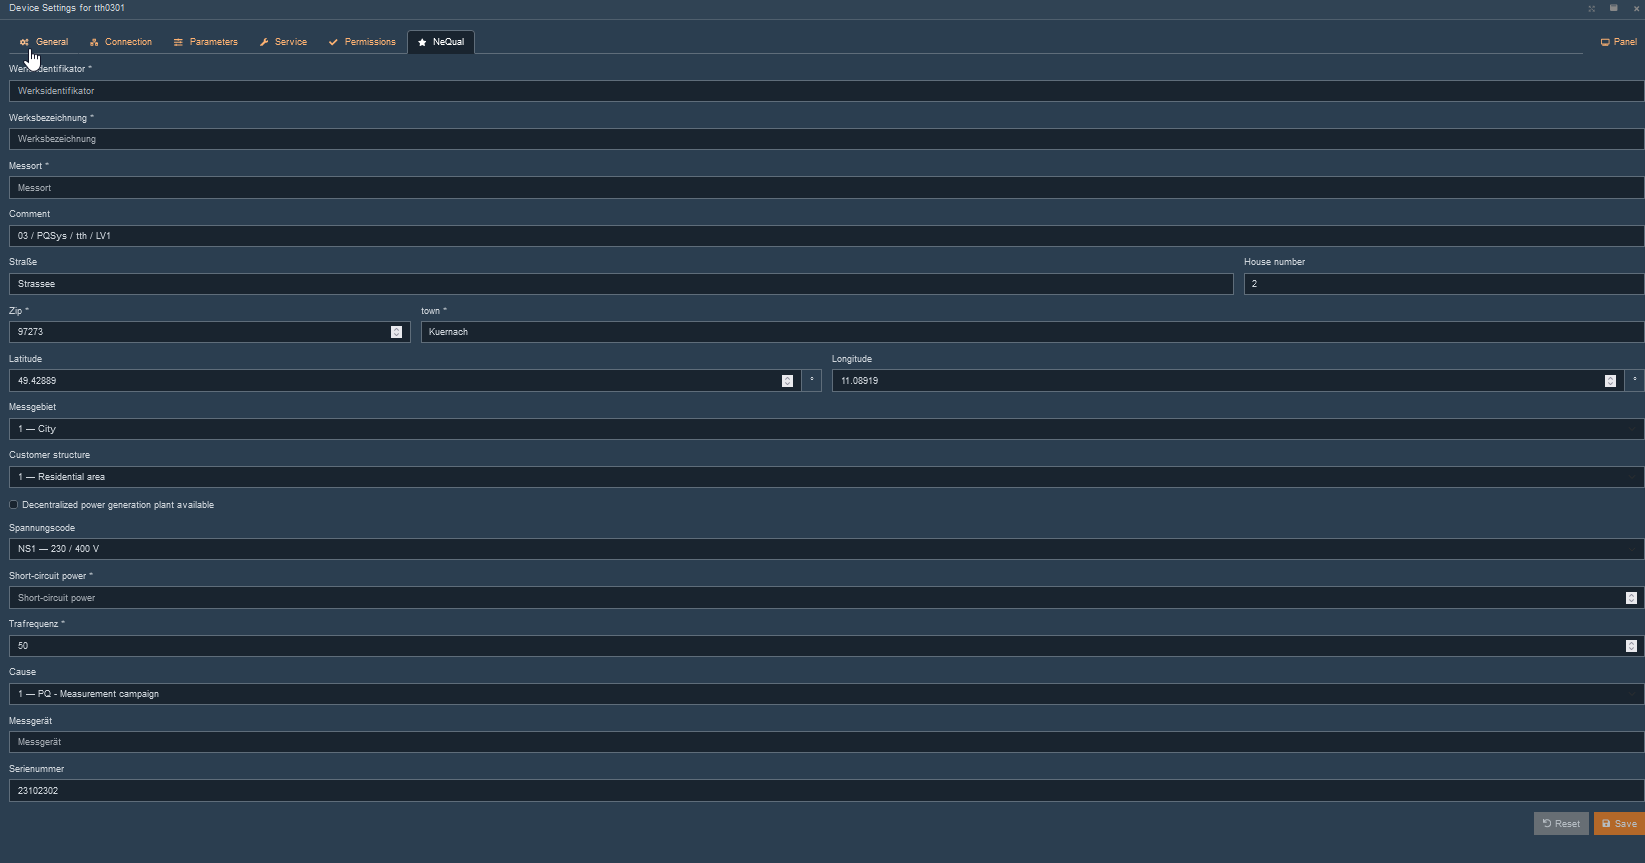
If a NeQual license is available, general settings for the export must be configured per measuring point.
These settings are persistently stored in the database and used for each export (manual or automatic).
Mandatory fields are marked with a * and must be filled out.
With Fleet Management, many devices can be managed in parallel.
This requires at least WebPQ Professional with the additional license "Fleet Management" or WebPQ Enterprise, which includes this function by default.
This function significantly facilitates the management of many measuring devices and enables more efficient use of working time. Especially in the area of patch management and security updates, fleet management offers great advantages.
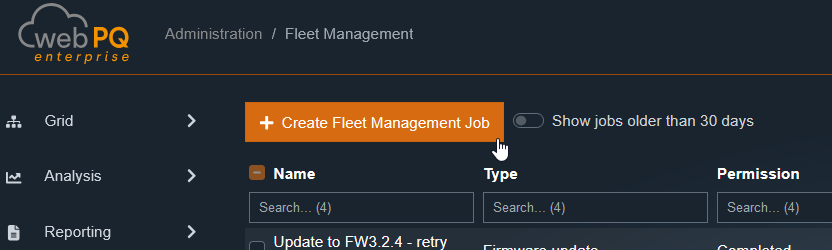
Fleet management can be found under "Settings > Fleet Management".
The permission "Device Management" is required for use.
Three central functions are available:
Download the current parameter file
Transfer an existing power quality standard template to multiple devices
Firmware update for multiple devices simultaneously
Send individual parameters to many devices
The user is guided through the first three functions by a wizard that facilitates all necessary steps.
At the end, the task is handed over to the server, which executes it in the background depending on the selected devices.
Logging out does not interrupt the job!
Each task receives a unique name, which is then displayed in a clear table with the respective status.
For the fourth option – "Send individual parameters to many devices" – access is via a device using the export function.
Detailed information can be found under Devices >> Parameterization.
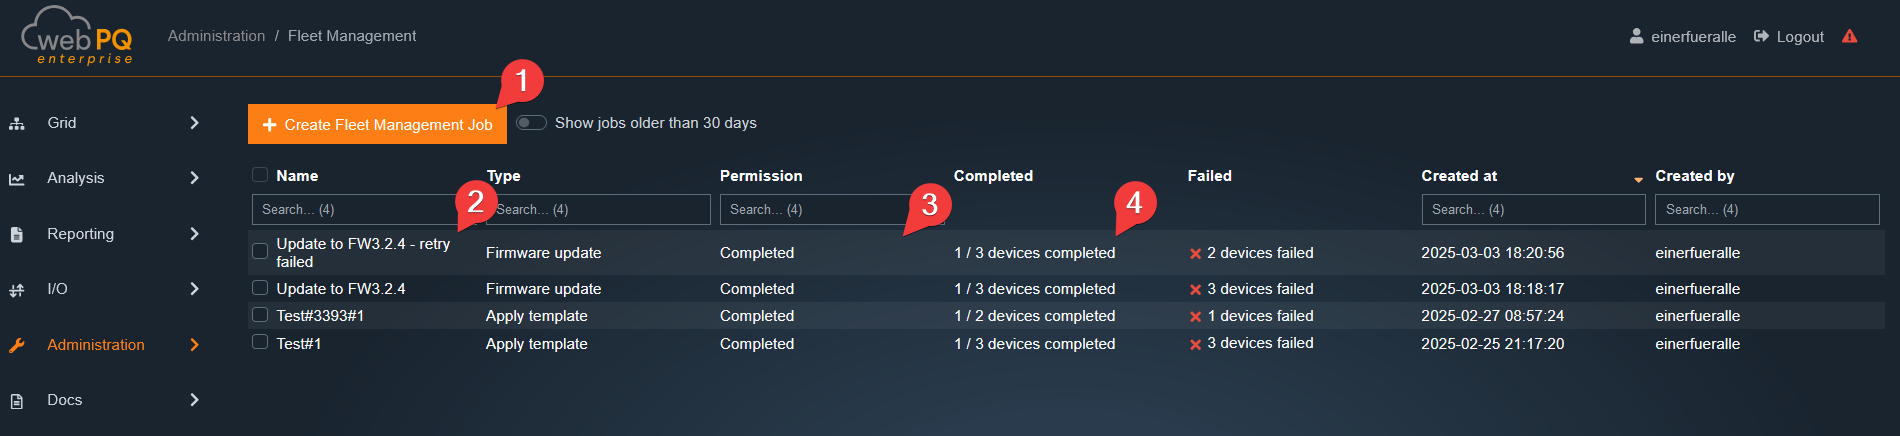
By clicking on a job, the user can view detailed information about the respective task.
If a task fails – e.g., due to unreachable devices, individual devices can be specifically reprocessed. This can be done by simply repeating the job under #1.
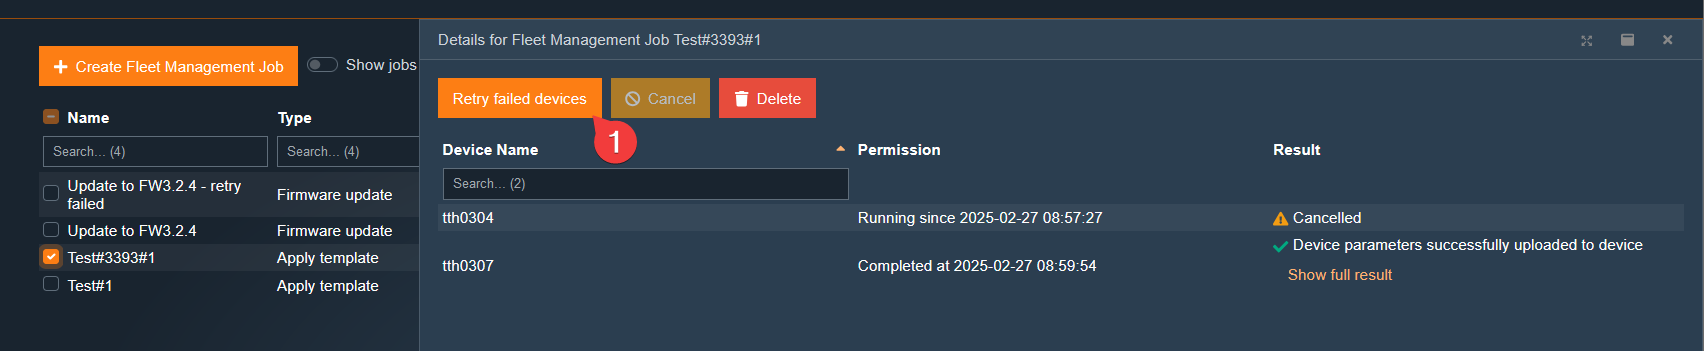
Access is regulated by users, devices, tenants, device groups, and permissions. Users, devices, and device groups are "owned" by a tenant. Additionally, each user can have permissions for specific devices. They can only interact with objects that belong to their tenant and for which they have the necessary permissions.
Starting with WebPQ V2.1, the WebPQ application will also feature an LDAP interface that enables importing and synchronizing users and groups from an LDAP directory (e.g., Microsoft Active Directory). This allows you to centralize user management and enhance security. For more information, see the chapter LDAP Integration.
Every data access to users, devices, or tenants requires a permission. For example, to read the measurements of a device, the user and the device must be granted the "Read Measurements" permission.
A permission can be valid for all objects within a tenant or only for a single device. To distinguish between these two types of permissions, we call them tenant permissions or device permissions.
Tenant Permissions
Change device metadata:
Allows changing the description or location of a device. Equivalent to granting the device permission Change Metadata for every device in your tenant.
Change user metadata: Change the password or contact information of a user.
Create and delete devices
Create and delete sub-tenants
Create and delete users
Migrate users and devices:
Changes the owner tenant of a user or device to another sub-tenant of yours.
Change permissions on any tenant device:
This permission is different from all other permissions a user can have. When granted, the user can grant any device permission of any device in their tenant to any user in their tenant, including themselves.
Manage tasks
Grant license management permissions
Grant tenant management permissions
Migrate users and devices
Device Permissions
Read measurements:
The most important permission on WebPQ. It is required to perform an analysis of device measurement data.
Change metadata:
Like the tenant permission Change device metadata. Allows changing the description or location of a specific device.
Publish measurements:
This permission currently has no effect. It will be used in the future to allow services to publish measurement data.
Delete measurements:
This permission currently has no effect. It will be used in the future to allow the deletion of past measurement data points.
Update firmware:
This permission is necessary if a user or user group needs to update the firmware on the devices.
Parameterize devices:
This permission is necessary if a user or user group needs to set parameters on the devices.
Permission States
Sometimes it is not enough to just grant a permission. If you want to grant a permission to your colleague, you must also be authorized to grant this permission to someone else. In this case, the permission must be in the state "can grant" or "fully granted".
The four states in which a user's permission can be are as follows:
Denied:
The permission is not granted to the user, and they are not allowed to grant it to any other user (including themselves).
Granted:
The permission is granted to the user. However, they are not allowed to grant it to other users.
Can grant:
The permission is not granted to the user, but they can change the status of the permission for all users in their tenant, including themselves!
Fully granted:
The combination of Granted and Can Grant. The permission is granted to the user, and they are also allowed to change the permission status of all users in their tenant.
Device Permissions are Granted in a Three-Tier Model:
A user can have the permission Change permissions on any tenant device in their tenant permission set. This permission allows editing any other permission of any device in the tenant and its sub-tenants.
A user can be listed in a user group, and this group grants permissions for specific devices.
A user can have direct permissions for devices.
All permissions are positive. This means that if a user is granted a permission on a device by a user group or directly, this permission cannot be revoked by another user group.
This function requires the "Create Users" permission.
Go to Users. Press "New User" (#1) to create a new user. A dialog will appear asking for details.
Enter an alphanumeric username and assign a password to the user.
First name, last name, and email must also be entered correctly.
Select a tenant in the tenant selection.
Select one or more devices that the user is allowed to see (optional).
Press "OK" to create the user.
This function requires the "Change User Metadata" permission.
Go to Users. Select the user and edit the desired fields. Press "Update".
This function requires the "Create and Delete Users" permission.
Go to Users. Select the user.
Click on "Delete User" in the upper left corner.
User groups are used for easy administration of many devices. The WebPQ software has three standard user groups:
root_default_users
root_default_operators
root_default_administrators
To use this function, you need the permission to change permissions on any tenant device in your tenant.
Go to User Group.
Click on "New User Group" (#1).
Enter a name, add users and devices (#2 and #3).
Select a tenant.
Adjust the permissions for the devices of the user group and click "Update" (#4).
Press "Update" (#5).
License Required
Tenants are used to isolate resources (users, devices) through administrative rights and data storage. The global settings for tenant management are also defined in the tenant settings. These settings are:
Password policies for the tenant and sub-tenants
Email settings for the tenant and sub-tenants
Report settings for the tenant and sub-tenants
This function requires the permission to create and delete sub-tenants.
Go to Tenants. Press "New Tenant" #1 to create a new tenant.
Enter the parent name.
Select your own tenant as the parent tenant.
Press "OK" to complete the creation of the tenant.
This function requires the permission to create and delete sub-tenants.
Go to Tenants. Select a tenant.
Click on "Delete Tenant" in the lower left corner (#7) and confirm the process.
Only tenants without assigned users and devices can be deleted.
This function requires the permission to change tenant settings.
Go to Tenants. Select a tenant.
Click on Password Policies.
Enter the desired password policies.
Click on Update Tenant.
Note on Default Password Policies
If the password policies for a tenant are deactivated, the default password policies will automatically apply.
These default values are configured as follows:
Minimum password length: 20 characters
At least 6 lowercase letters
At least 5 uppercase letters
At least 4 special characters
At least 3 digits
No minimum interval for password changes
Maximum password validity: 3650 days
This function requires the permission to change tenant settings.
Go to Tenants. Select a tenant.
Click on Email Settings.
Enter the SMTP server data.
Select the port and encryption method.
Enter the login credentials.
Click on Update Tenant.
Using the Test Email function, you can send a test email to the specified address.
This function requires the permission to change tenant settings.
Here, the logos for the reports are globally defined for the tenant.
Go to Tenants. Select a tenant.
Click on Report Settings.
Choose whether the report should inherit the settings from the parent tenant or use a different logo.
If you want to use a different logo, you can upload it via "Browse".
Note: This feature is available in the Enterprise Edition starting from WebP V2.1.
LDAP integration allows you to import and synchronize users and groups from an LDAP directory (e.g., Microsoft Active Directory). This enables centralized user management and simplifies user administration.
After enabling LDAP integration, users can log in to WebPQ directly using their LDAP credentials (username and password). Authentication is performed via the connected LDAP server. On first login, users are automatically assigned to the WebPQ group root_default_users.
Each LDAP user is counted as a separate unit and is included in the license calculation—licensing for LDAP users is identical to regular users.
Note: Automatic synchronization of LDAP groups is currently not supported. All LDAP users are added exclusively to the root_default_users group. Permissions for LDAP users must be assigned manually via groups in the WebPQ application, as the LDAP server cannot manage application-specific permissions.
Basic Settings LDAP integration is configured in the WebPQ backend under Settings > LDAP. The following settings are available:
Enable LDAP: Activate this option to enable LDAP integration.
Host - LDAP Server: Enter the address of your LDAP server (e.g., ldap.example.com).
Port: Enter your LDAP server's port (default: 389 for unencrypted LDAP, 636 for LDAPS).
Use TLS: Enable this option if your LDAP server uses SSL/TLS for the connection.
Ignore certificate errors: Enable this option if you use self-signed certificates and want to ignore certificate errors.
Custom CA certificate (optional): Add a custom CA certificate here if your LDAP server uses a certificate not issued by a widely recognized certificate authority.
Connect Timeout: Specify the connection timeout in seconds (default: 10 seconds).
Close Client after: Specify the time in seconds after which the LDAP connection will be closed if no longer needed (default: 300 seconds).
LDAP Search Settings:
Bind DN: Enter the Distinguished Name (DN) of the user used to bind to the LDAP server (e.g., cn=admin,dc=example,dc=com).
Password: Enter the password for the bind user. Leave blank for anonymous binding.
Base DN: Enter the base DN from which the search for users and groups starts (e.g., dc=example,dc=com).
Search filter: Define an LDAP filter to find users, e.g., ((&(objectClass=user)(sAMAccountName={{username}}))).
Note: Some LDAP servers have case-sensitive attribute names. For example, cn and CN may be treated differently. Make sure to write the attributes exactly as they are stored on the LDAP server.
User Properties Mapping: Use the test function below to view all available LDAP properties from your LDAP server.
Username Attribute: Enter the LDAP attribute containing the username (default: uid). Note: "sAMAccountName" is recommended for Microsoft Active Directory.
First Name Attribute: Enter the LDAP attribute containing the first name (default: givenName).
Last Name Attribute: Enter the LDAP attribute containing the last name (default: sn).
Email Attribute: Enter the LDAP attribute containing the email address (default: mail).
With Test Connection, you can test the connection to the LDAP server and verify if the configuration is correct. With Save, the settings are applied.
Test Username (testing only): Enter a username to test the LDAP search.
Test Result: Displays the results of the LDAP search for all parameters. If the user is found, the mapped attributes are shown.
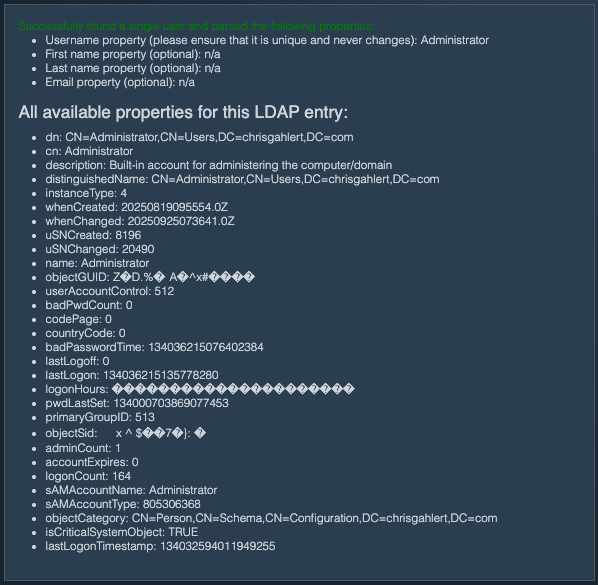
Note: This feature is available in the Enterprise Edition starting from WebPQ V2.1.
OAuth integration allows you to use an external OAuth 2.0 / OpenID Connect provider (e.g., Microsoft Entra ID, Keycloak, Okta) for user authentication in WebPQ. This enables single sign-on (SSO) and centralizes identity management with your existing identity provider.
When OAuth is enabled, the login page will display an additional button allowing users to authenticate via the configured OAuth provider:
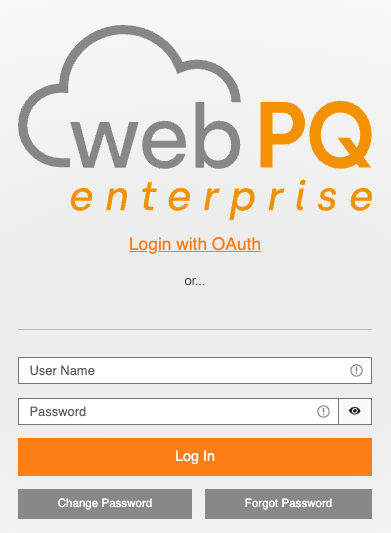
After enabling OAuth integration, users can log in to WebPQ by clicking the OAuth login button on the login page. They will be redirected to the configured OAuth provider for authentication. Upon successful authentication, users are redirected back to WebPQ and automatically logged in.
If autoRedirect is enabled, WebPQ redirects users to the OAuth provider automatically when they open the login page. The regular login page is then only shown again if WebPQ has to display an OAuth error message or after an explicit logout.
On first login, OAuth users are automatically created in WebPQ and assigned to the root_default_users group. Each OAuth user is counted as a separate unit and is included in the license calculation—licensing for OAuth users is identical to regular users.
On later logins, WebPQ compares the returned OAuth user data with the locally stored OAuth user and updates the stored first name, last name, and email address if they changed at the provider.
Note: Automatic synchronization of groups from the OAuth provider is currently not supported. All OAuth users are added exclusively to the root_default_users group. Permissions for OAuth users must be assigned manually via groups in the WebPQ application.
If a local non-OAuth user already exists with the same username, the OAuth login is rejected. The same applies if an existing OAuth user is found with the same username but a different external ID than before.
If WebPQ is configured to require acceptance of the current privacy policy, the user is taken to the normal application startup first, but the application remains blocked by a consent dialog until the privacy policy is accepted. If the user declines, WebPQ logs the user out again.
Unlike LDAP, OAuth integration is not configured through the WebPQ user interface. Instead, it must be configured by manually editing the settings.json file.
Where to find the settings.json file:
The location of the settings.json file depends on your installation. You can find the path in the WebPQ administrative backend under Other (see Installation - Part 6). Typical locations include:
Windows (Electron): %ProgramData%\WeSense\WebPQ\settings.json
Docker / Kubernetes: Mounted as a volume or configured via environment variables
To enable OAuth, add or modify the oauth section within the settings.json file. After making changes, restart the WebPQ service for the new configuration to take effect.
Example configuration:
{
    "oauth": {
        "clientId": "your-client-id",
        "clientSecret": "your-client-secret",
        "scope": "openid profile email",
        "discoveryUrl": "https://your-provider.com/.well-known/openid-configuration"
    }
}The following settings are available in the oauth section of settings.json:
Required Settings
clientId(string, required): The OAuth client ID used to identify WebPQ with the OAuth provider. You receive this value when registering WebPQ as an application in your OAuth provider.
clientSecret(string, required): The OAuth client secret used to authenticate WebPQ with the OAuth provider. Keep this value confidential. You receive this value when registering WebPQ as an application in your OAuth provider.
scope(string, required): The scopes to request from the OAuth provider, as a space-separated list. Common values include "openid profile email". The openid scope is typically required for OpenID Connect providers.
Server Discovery
You must configure either a discoveryUrl or the server property, but not both.
discoveryUrl(string, optional): The OpenID Connect discovery URL (typically ending in /.well-known/openid-configuration). When provided, WebPQ will automatically retrieve all necessary endpoint information from the OAuth provider. This is the recommended approach.
Example: "https://login.microsoftonline.com/{tenant-id}/v2.0/.well-known/openid-configuration"
Note: Replace {tenant-id} with your actual Microsoft Entra ID (Azure AD) tenant ID.
server(object, optional): If your OAuth provider does not support discovery, you can provide the server metadata directly. The following three endpoint properties are required when using this option:
authorization_endpoint(string, required): The URL where users are redirected for authentication.
token_endpoint(string, required): The URL used to exchange the authorization code for tokens.
userinfo_endpoint(string, required): The URL used to retrieve user profile information.
Additionally, you can provide any other properties supported by the OpenID Connect server metadata specification. Common optional properties include:
issuer(string): The issuer identifier of the OAuth provider.
jwks_uri(string): The URL of the JSON Web Key Set for token signature verification.
end_session_endpoint(string): The URL to redirect users to for logout at the OAuth provider.
scopes_supported(string[]): The list of scopes supported by the OAuth provider.
response_types_supported(string[]): The response types supported by the OAuth provider.
For a complete list of available properties, see the openid-client ServerMetadata documentation.
Example:
{
    "server": {
        "issuer": "https://your-provider.com",
        "authorization_endpoint": "https://your-provider.com/oauth2/authorize",
        "token_endpoint": "https://your-provider.com/oauth2/token",
        "userinfo_endpoint": "https://your-provider.com/oauth2/userinfo",
        "end_session_endpoint": "https://your-provider.com/oauth2/logout"
    }
}
User Field Mapping
These settings control how user information from the OAuth provider is mapped to WebPQ user properties. The values refer to field names in the response returned by the OAuth provider's userinfo endpoint.
customUsernameField(string, optional): The field in the user info response that contains the username. Defaults to "sub".
customEmailField(string, optional): The field that contains the user's email address. Defaults to "email".
customExternalIdField(string, optional): The field that contains an external ID for the user. Defaults to the same value as the username field.
customPreNameField(string, optional): The field that contains the user's first name. Defaults to "given_name".
customSurNameField(string, optional): The field that contains the user's last name. Defaults to "family_name".
Tip: If you are unsure which fields your OAuth provider returns, enable the debug option (see Advanced Settings below). This will log the full userinfo response from the OAuth server to the authentication log, including all available fields and their values, making it easy to identify the correct field names for the mapping above. Search for the log message containing [OAUTH Debug] Retrieved user info to find the relevant log entry.
Behavior Settings
oauthOnly(boolean, optional): When set to true, the standard login form for local user authentication is hidden, and only the OAuth login option is shown. Defaults to false.
autoRedirect(boolean, optional): When set to true, users visiting the login page will be automatically redirected to the OAuth provider instead of seeing the login page. Defaults to false.
WebPQ suppresses this automatic redirect while it is handling a just-finished OAuth login, an OAuth error, or an explicit logout. This prevents immediate redirect loops.
skipLogoutRedirect(boolean, optional): When set to true, logging out of WebPQ will not redirect the user to the OAuth provider's logout endpoint. The user will only be logged out of WebPQ, but their OAuth session may remain active. Defaults to false.
If skipLogoutRedirect is false, WebPQ only redirects to the OAuth provider when the provider metadata contains an end_session_endpoint. Otherwise WebPQ falls back to a local logout and returns to the login page.
loginText(string, optional): Custom text to display on the OAuth login button instead of the default "Login with OAuth" text.
Advanced Settings
redirectUriBase(string, optional): The base URL used for constructing the OAuth redirect URI. The full redirect URI will be this base URL followed by /authenticate/oauth/callback. Only set this if the redirect URI is not detected correctly by WebPQ automatically.
debug(boolean, optional): When set to true, detailed debug information about the OAuth login process is written to the authentication log. This is helpful for troubleshooting issues or identifying the correct field names for user mapping. Defaults to false.
Warning: Enabling this option causes sensitive information (such as tokens, user details, and other authentication data) to be written to the authentication log. Only enable it temporarily for troubleshooting and disable it again afterwards.
The debug log messages are located in the logs folder at %PROGRAMDATA%\aeberle\logs\. If the audit log feature has been enabled, the log messages are found in the audit subfolder. Otherwise, they are written to the main log file, where they are prefixed with auth-logger.
Example log output:
[master-data-auth-logger][2026-03-25T22:02:58.987Z][INFO] [OAUTH Debug] Starting OAuth authentication flow
[master-data-auth-logger][2026-03-25T22:02:59.113Z][INFO] [OAUTH Debug] Parsed OAuth server configuration: {
  "token_endpoint": "https://login.microsoftonline.com/12345678-1234-1234-1234-123456789012/oauth2/v2.0/token",
  "token_endpoint_auth_methods_supported": [
    "client_secret_post",
    "private_key_jwt",
    "client_secret_basic",
    "self_signed_tls_client_auth"
  ],
  "jwks_uri": "https://login.microsoftonline.com/12345678-1234-1234-1234-123456789012/discovery/v2.0/keys",
  "response_modes_supported": [
    "query",
    "fragment",
    "form_post"
  ],
  "subject_types_supported": [
    "pairwise"
  ],
  "id_token_signing_alg_values_supported": [
    "RS256"
  ],
  "response_types_supported": [
    "code",
    "id_token",
    "code id_token",
    "id_token token"
  ],
  "scopes_supported": [
    "openid",
    "profile",
    "email",
    "offline_access"
  ],
  "issuer": "https://login.microsoftonline.com/12345678-1234-1234-1234-123456789012/v2.0",
  "request_uri_parameter_supported": false,
  "userinfo_endpoint": "https://graph.microsoft.com/oidc/userinfo",
  "authorization_endpoint": "https://login.microsoftonline.com/12345678-1234-1234-1234-123456789012/oauth2/v2.0/authorize",
  "device_authorization_endpoint": "https://login.microsoftonline.com/12345678-1234-1234-1234-123456789012/oauth2/v2.0/devicecode",
  "http_logout_supported": true,
  "frontchannel_logout_supported": true,
  "end_session_endpoint": "https://login.microsoftonline.com/12345678-1234-1234-1234-123456789012/oauth2/v2.0/logout",
  "claims_supported": [
    "sub",
    "iss",
    "cloud_instance_name",
    "cloud_instance_host_name",
    "cloud_graph_host_name",
    "msgraph_host",
    "aud",
    "exp",
    "iat",
    "auth_time",
    "acr",
    "nonce",
    "preferred_username",
    "name",
    "tid",
    "ver",
    "at_hash",
    "c_hash",
    "email"
  ],
  "kerberos_endpoint": "https://login.microsoftonline.com/12345678-1234-1234-1234-123456789012/kerberos",
  "mtls_endpoint_aliases": {
    "token_endpoint": "https://mtlsauth.microsoft.com/12345678-1234-1234-1234-123456789012/oauth2/v2.0/token"
  },
  "tls_client_certificate_bound_access_tokens": true,
  "tenant_region_scope": "EU",
  "cloud_instance_name": "microsoftonline.com",
  "cloud_graph_host_name": "graph.windows.net",
  "msgraph_host": "graph.microsoft.com",
  "rbac_url": "https://pas.windows.net"
}
[master-data-auth-logger][2026-03-25T22:02:59.115Z][INFO] [OAUTH Debug] Using OAuth parameters: {
  "redirect_uri": "https://my-webpq.example.com/authenticate/oauth/callback",
  "scope": "openid profile email",
  "code_challenge": "...",
  "code_challenge_method": "S256",
  "state": "..."
}
[master-data-auth-logger][2026-03-25T22:02:59.122Z][INFO] [OAUTH Debug] Redirecting user to URL: https://login.microsoftonline.com/12345678-1234-1234-1234-123456789012/oauth2/v2.0/authorize?redirect_uri=https%3A%2F%2Fmy-webpq.example.com%2Fauthenticate%2Foauth%2Fcallback&scope=openid+profile+email&code_challenge=...&code_challenge_method=S256&state=...&client_id=...&response_type=code
[master-data-auth-logger][2026-03-25T22:02:59.122Z][INFO] [OAUTH Debug] Saving OAuth session data to cookie: {
  "codeVerifier": "...",
  "state": "...",
  "redirectPath": "https://my-webpq.example.com/"
}
[master-data-auth-logger][2026-03-25T22:03:09.869Z][INFO] [OAUTH Debug] Starting OAuth callback
[master-data-auth-logger][2026-03-25T22:03:09.870Z][INFO] [OAUTH Debug] Parsed OAuth session data from cookie: {
  "codeVerifier": "...",
  "state": "...",
  "redirectPath": "https://my-webpq.example.com/"
}
[master-data-auth-logger][2026-03-25T22:03:09.870Z][INFO] [OAUTH Debug] Using callback URL to parsed OAuth information: https://my-webpq.example.com/authenticate/oauth/callback?code=...&session_state=...
[master-data-auth-logger][2026-03-25T22:03:10.117Z][INFO] [OAUTH Debug] Retrieved tokens: {
  "token_type": "bearer",
  "scope": "email openid profile",
  "expires_in": 3941,
  "ext_expires_in": 3941,
  "access_token": "...",
  "id_token": "..."
}
[master-data-auth-logger][2026-03-25T22:03:10.346Z][INFO] [OAUTH Debug] Retrieved user info: {
  "sub": "...",
  "name": "...",
  "family_name": "...",
  "given_name": "...",
  "email": "...",
  "picture": "https://graph.microsoft.com/v1.0/me/photo/$value"
}
[master-data-auth-logger][2026-03-25T22:03:10.347Z][INFO] [OAUTH Debug] User ... already exists in local storage, checking external source...
[master-data-auth-logger][2026-03-25T22:03:10.349Z][INFO] [OAUTH Debug] User details changed for ..., updating...
[master-data-auth-logger][2026-03-25T22:03:10.369Z][INFO] [OAUTH Debug] Authenticated with username: ...
[master-data-auth-logger][2026-03-25T22:03:10.372Z][INFO] [OAUTH Debug] Redirecting user to URL: /?oauth-redirect=https%3A%2F%2Fmy-webpq.example.com%2F&oauth-success=1
[master-data-auth-logger-USER][2026-03-25T22:03:11.169Z][INFO] <13>1 2026-03-25T22:03:11.169Z localhost - - 100 - [IP: ...]: User ... logged in successfullyBelow is a complete example configuration using Microsoft Entra ID (formerly Azure AD) with discovery.
Note: Replace {tenant-id} with your actual Microsoft Entra ID (Azure AD) tenant ID.
{
    "oauth": {
        "clientId": "edd6e596-0da2-46dd-9f6b-1be0b3e9b9c3",
        "clientSecret": "your-client-secret-here",
        "scope": "openid profile email",
        "discoveryUrl": "https://login.microsoftonline.com/{tenant-id}/v2.0/.well-known/openid-configuration",
        "debug": false
    }
}OAuth login button does not appear: Ensure that clientId, clientSecret, and scope are all set in the configuration. All three fields are required for OAuth to be enabled.
The login page immediately jumps to the OAuth provider: This is expected when autoRedirect is enabled. To keep the local login form visible for troubleshooting, disable autoRedirect temporarily.
Users are not being created: Enable debug mode and check the authentication logs for details about the OAuth login process and the user info response from the provider.
OAuth login fails although the provider login was successful: Check whether a local user with the same username already exists as a non-OAuth user, or whether the provider now returns a different external ID than during the first login. In both cases WebPQ rejects the login to avoid linking the OAuth account to the wrong local user.
Wrong username or email is assigned: Use debug mode to inspect the fields returned by the OAuth provider's userinfo endpoint, then adjust the customUsernameField, customEmailField, and other field mapping settings accordingly.
Redirect URI mismatch: Ensure the redirect URI registered in your OAuth provider matches the one used by WebPQ. The redirect URI follows the pattern https://<your-webpq-host>/authenticate/oauth/callback. If needed, set redirectUriBase to override the detected base URL.
Logout returns to WebPQ, but the next login signs the user in again immediately: This usually means the OAuth provider session is still active. Either configure an end_session_endpoint in the provider metadata or disable skipLogoutRedirect=false so WebPQ can send the user to the provider logout endpoint.
Users are asked for privacy-policy consent after OAuth login: This is expected when the WebPQ instance requires consent to the current privacy policy and the user has not yet accepted the currently stored statement. The user must accept the dialog before the application becomes usable.
To provide users with a flexible way to organize and classify devices, the WebPQ software features a universal tagging system.
The concept includes the following core components:
Categories: These are divided into free categories and system categories.
Tags: Tags consist of system tags and free tags.
Each tag can be assigned to a category, and each device can receive one or more tags.
System tags and system categories depend on the connected device. An example is the system category Firmware, which is specifically used for measuring devices. Each measuring device has a system tag where the firmware version is automatically entered – either at the first contact with the device or after connection.
The settings for tagging and categories require the permission Change device metadata and are located in the menu Settings >> Device Tagging.
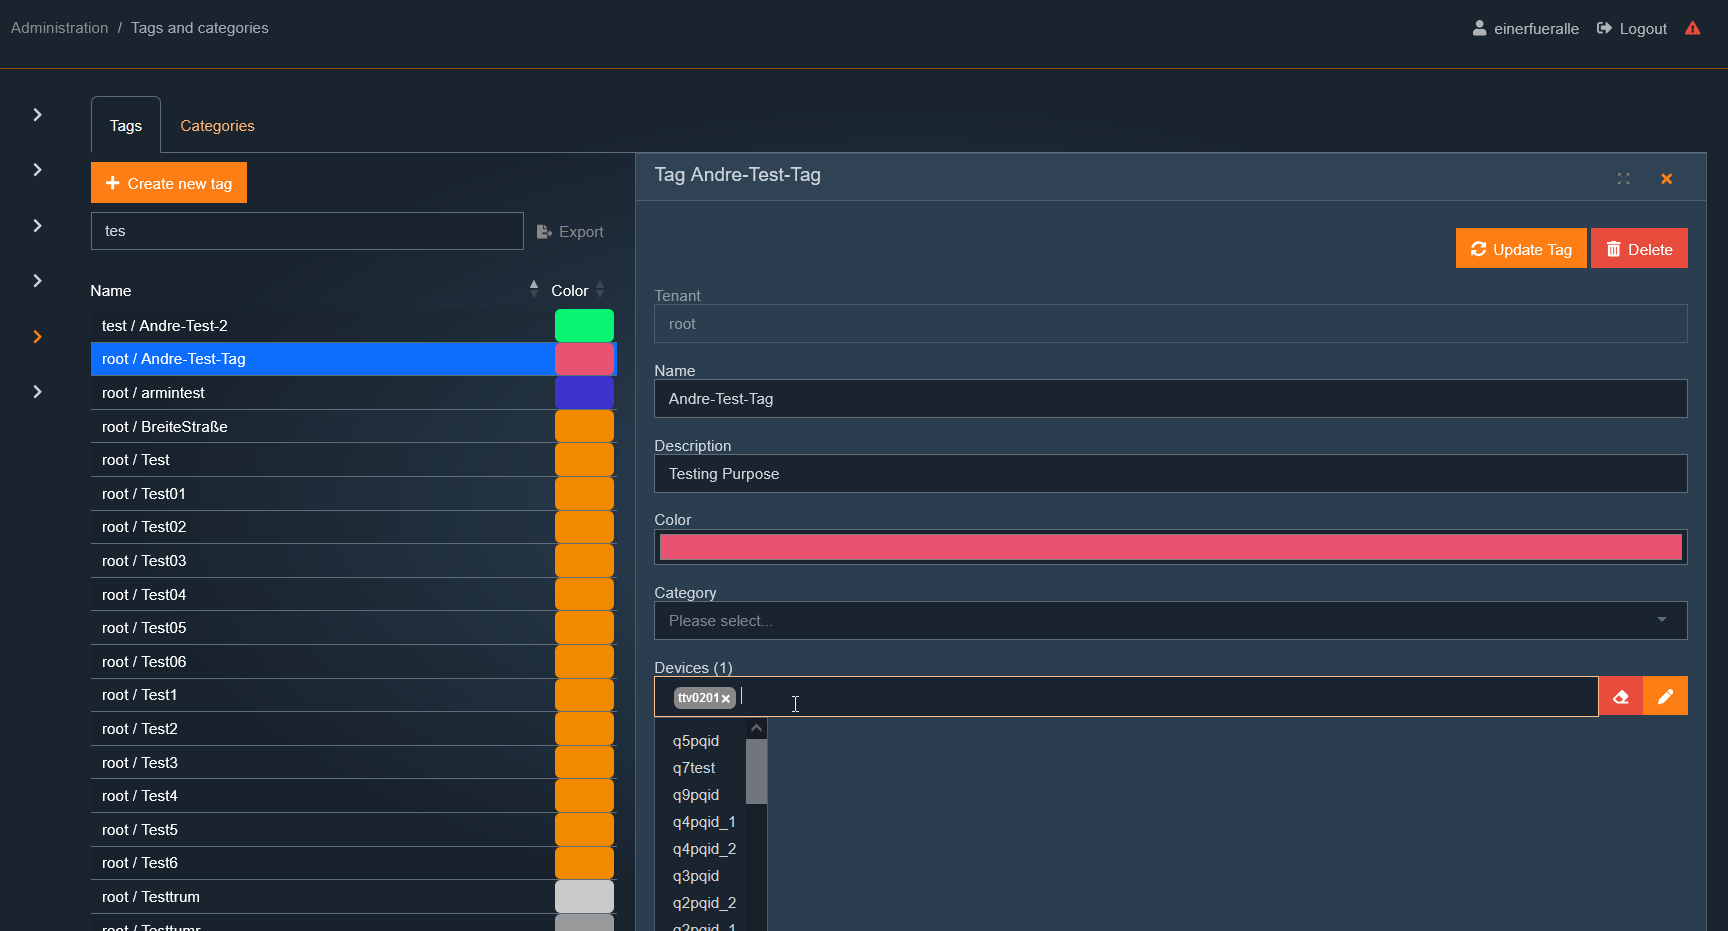
Click on "+ Create new category".
Enter a name for the new category, e.g., "Voltage Level".
Enter a unique description, e.g., "Category for defining the voltage level".
Select the tenant for which the category should be available, e.g., "root".
Assign a color to the category, e.g., "Black".
In the Categories section, the user can set the system-wide order of the hierarchical listing under #1.
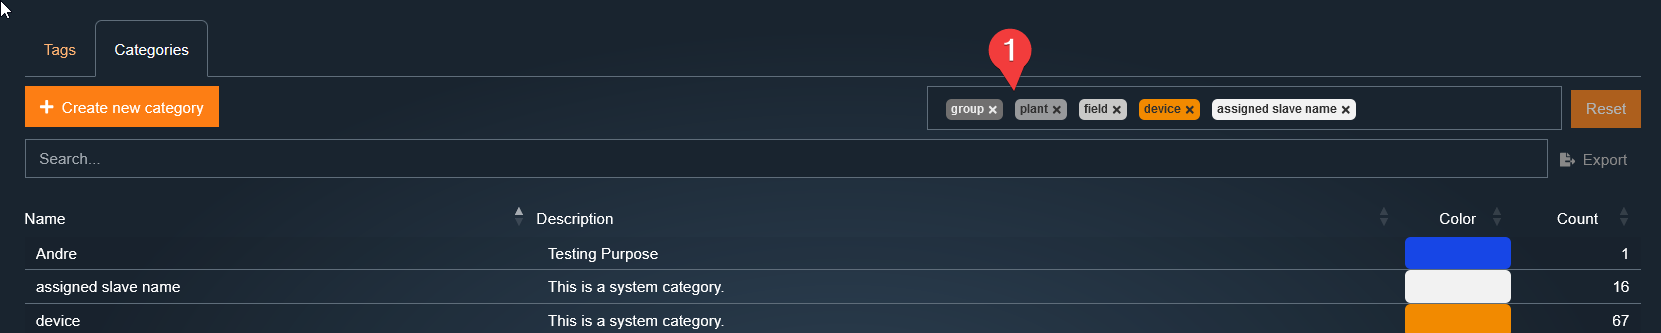
Procedure:
Click in the field #1 → All available categories will be displayed.
Enter the desired category in the dialog box.
Select the desired category.
Remove unnecessary categories if needed.
Example:
With these settings, all selection dialogs would be sorted in the following order:
Nominal voltage
Device name
Associated slaves in Modbus master mode
This standardized hierarchy ensures a uniform and logical sorting throughout the application.
To add a new tag, follow these steps:
Click on "# Create new tag".
Enter a name for the new tag, for example, "11kV".
Enter a unique description, such as "All devices with nominal voltage 11kV".
Select the tenant for which the tag should be available, for example, "root".
Assign the tag to a category, such as "Voltage Level".
Assign a color to the tag, for example, "Black".
After creating the tag, it can be found in the table and assigned to the corresponding devices by clicking on it. This allows efficient management and classification of devices based on the defined tags.
The License Management page shows the currently stored WebPQ license and is the central place for updating or reactivating it.
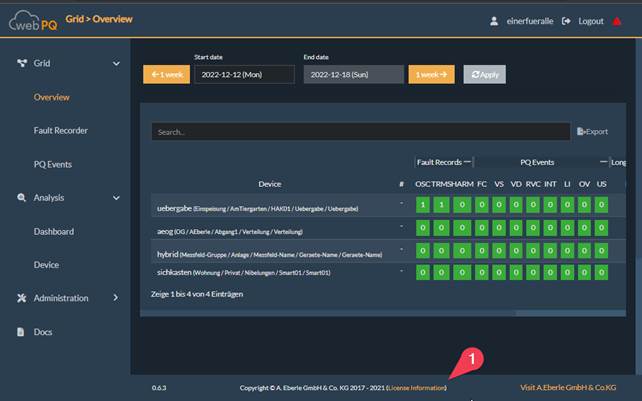
The page is primarily relevant for administrators with permission to manage licenses. Regular users can see the effects of a missing or inactive license, but they cannot complete the licensing steps themselves.
WebPQ uses a signed JSON license file that is provided via the A. Eberle licensing process.
The file name typically contains the product, order information, and a timestamp. Keep this file stored safely because it is needed again for updates, renewals, or support cases.
Example:
License-WebPQ Basic-2025-12-10T11_40_43.408Z.json
In License Management, a new license file can be loaded via + Add License.
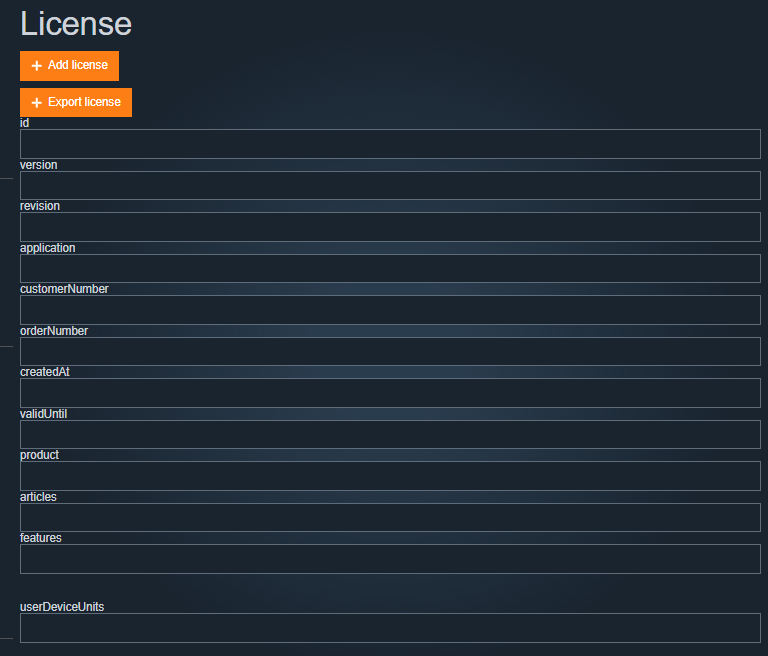
Procedure:
Click Browse and select the new JSON license file.
Confirm the displayed license content.
Store the license in WebPQ.
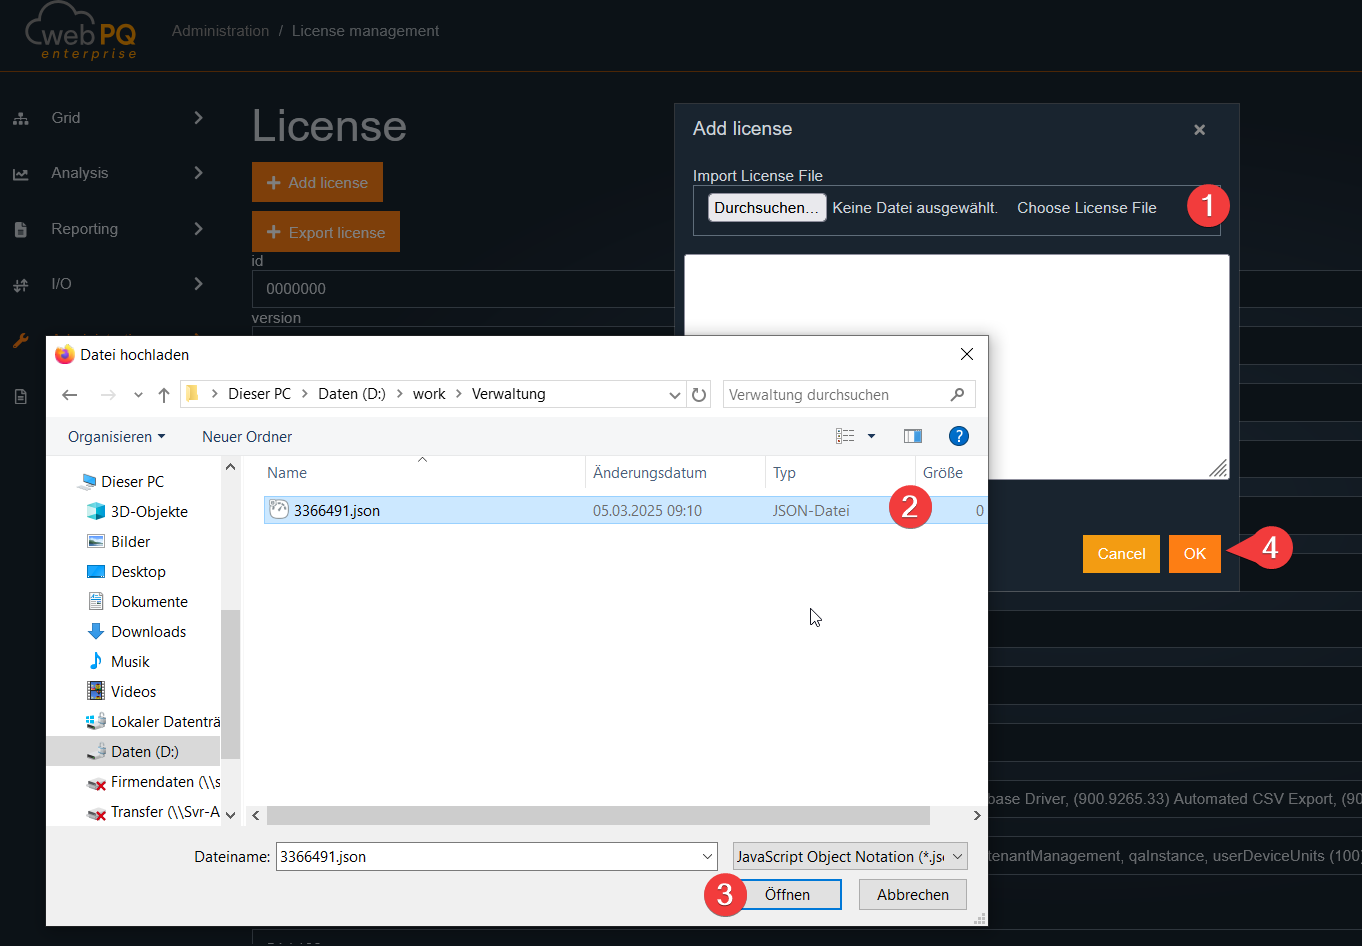
If the new license belongs to a different license ID than the activation already stored in the system, WebPQ shows a warning before replacing it. This warning means the system must be activated again for the new license.
If the license is updated but keeps the same license ID, the existing activation can remain valid.
Starting with WebPQ 2.1, the installation must also be activated in addition to storing the license file.
Activation is hardware-bound:
WebPQ generates a LicenseActivationRequest.json file for the current host.
This request is uploaded or pasted into the activation portal at https://activate-license.powerquality.cloud.
The portal returns an activation token or activation file.
That activation token is pasted back into WebPQ, or the activation file is imported there.
The activation request can be copied to the clipboard or saved as a file directly from WebPQ.
If the currently stored activation does not match the host hardware anymore, WebPQ reports a hardware mismatch and requires reactivation.
After a license has been installed but not yet activated, WebPQ allows a grace period of up to 30 days.
Administrators with license-management permission receive the activation dialog and can complete the process.
Other users only see a notice telling them to contact an administrator.
After the grace period has expired, the application is blocked until a valid activation has been entered.
The activation is tied to the hardware fingerprint of the host system. If the host is moved, replaced, or changed substantially, the stored activation is no longer valid.
In that case:
Generate a new activation request from WebPQ.
Try to activate it through the activation portal.
If the activation has already been used for the previous hardware, contact A. Eberle support so the activation can be reset.
Repeat the activation process with the reset license.
WebPQ distinguishes between:
the validity of the currently stored software license for using the product, and
the time window in which patches and software enhancements may be installed.
For standard licenses, updates are generally covered for 12 months from purchase. If this update period has expired, the installed software can continue to run, but WebPQ shows a warning that patches and software enhancements are no longer covered.
Administrators can hide this warning temporarily. WebPQ shows it again later after a longer period.
If you want to install a newer version after the update entitlement has expired, you need a renewed license or maintenance extension.
Some product variants, especially SaaS-oriented licenses, can be issued as infinite licenses. In that case WebPQ stores the license without a calendar expiration date.
For users, this means:
the license validity itself does not end on a specific date,
the product is shown as permanently valid instead of displaying a normal expiry date,
but activation and product-specific feature checks still continue to apply.
If an update requires a renewed or different license, load the new JSON license first or during the update process.
If the new license uses a different license ID than the previous one, expect WebPQ to request a fresh activation after the replacement.
For the installation-side activation flow, see the installation chapter.
Keep the currently used license file available.
Note the visible license ID from WebPQ when contacting support.
For host migration or hardware replacement, mention that reactivation is required.
For update entitlement extensions, send the current license information or license ID to A. Eberle.
In the data protection settings, it is possible to store company-specific data protection policies in the software.
The software offers multilingual templates to document the exact circumstances of data storage and processing in the system.
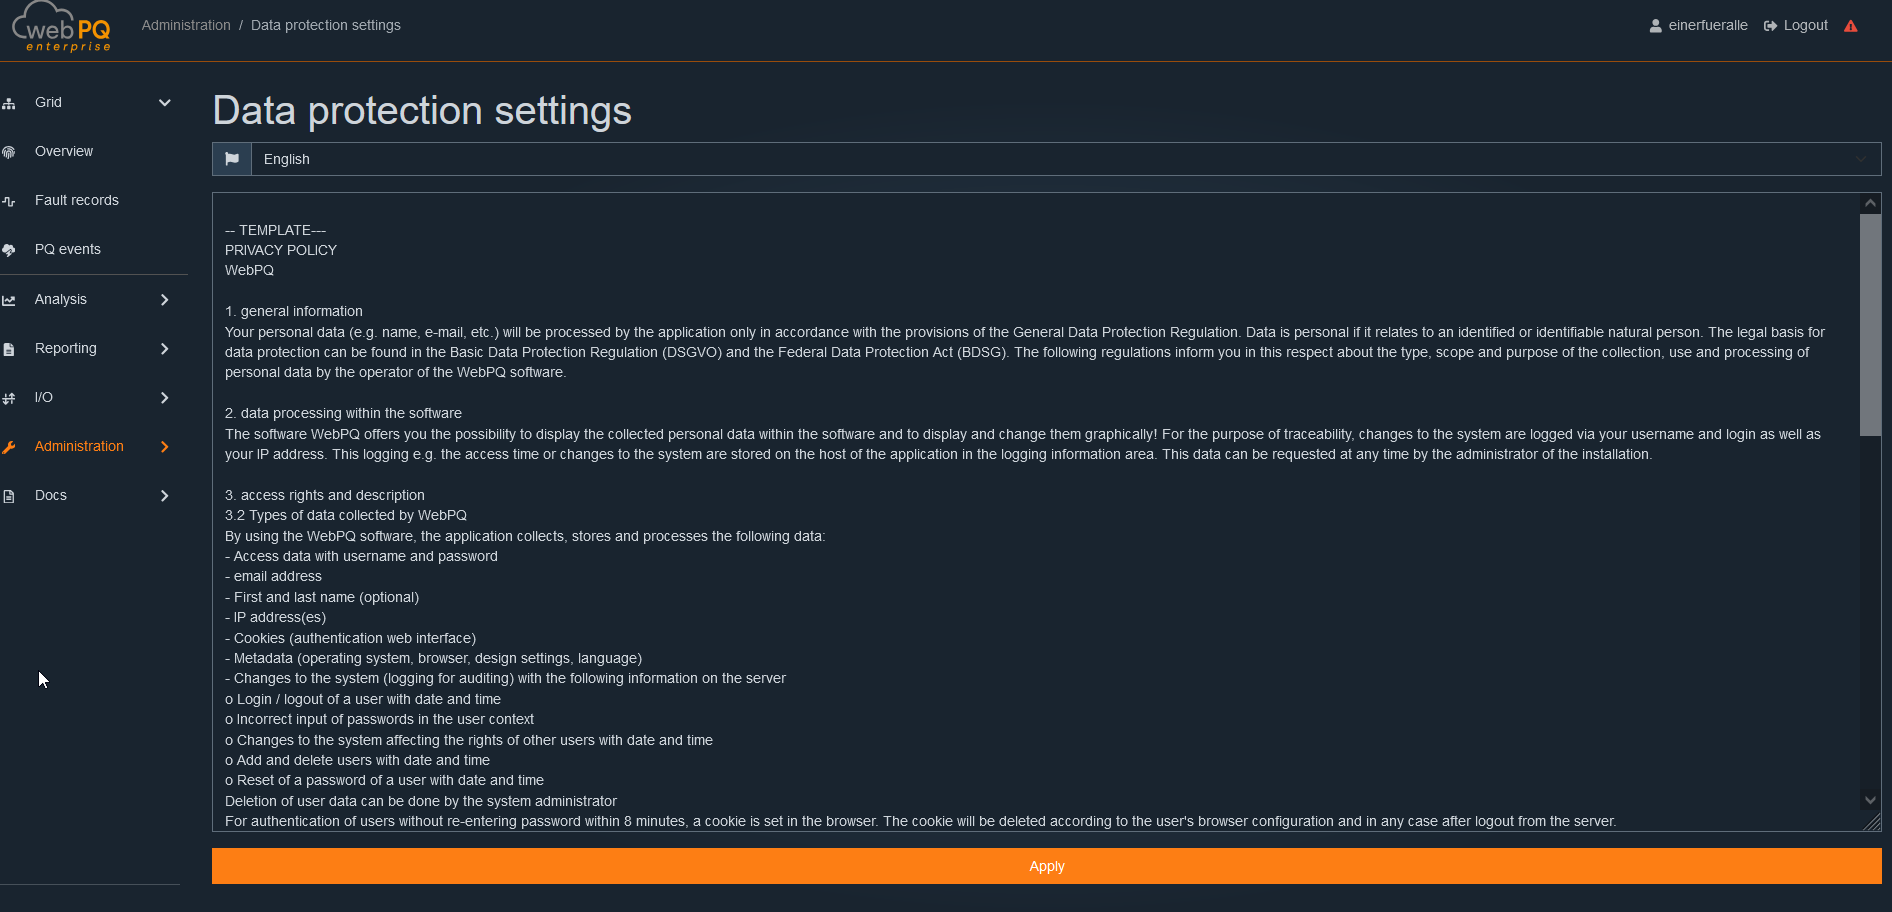
Users can edit the data protection policies in multiple languages directly in the editor and save them in the system.
After saving, the updated data protection agreement is automatically applied as the default.
It is visible both in the login area and in the footer of the software.
The WebPQ application typically loads a large amount of data to provide a comprehensive and detailed display of the content. However, if an error occurs, such as when the connection to the server is interrupted, the browser may not be able to load further data. In such a case, it can be helpful to press the F5 key or the CTRL + R key combination. This will reload the webpage and send a new request to the server, restoring the data connection and reloading the content.
To ensure smooth operation in the browser, cookies should be allowed on the PC being used. The cache should be persistently stored at least for the "WebPQ" application. The WebPQ application stores metadata and customer-specific settings, such as those of the "Analysis Cockpit," locally in the "local storage." This prevents unnecessary data transfers from the server to the client and enables quick analyses. If cookies are deleted after leaving the browser, settings are not persisted and may need to be reconfigured. To prevent this, we recommend setting exceptions in the browser for the application.
Procedure (example using the "Firefox" browser):
Open the settings in the browser
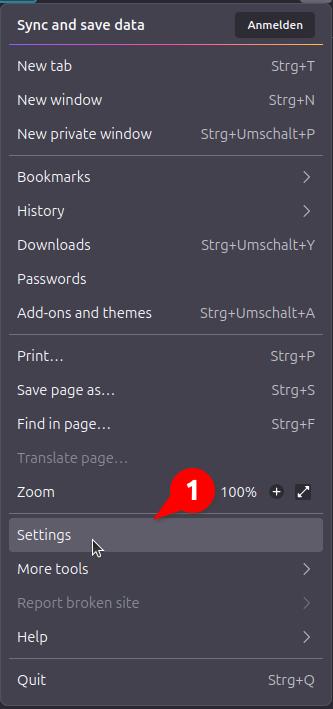
Go to the "Privacy & Security" settings
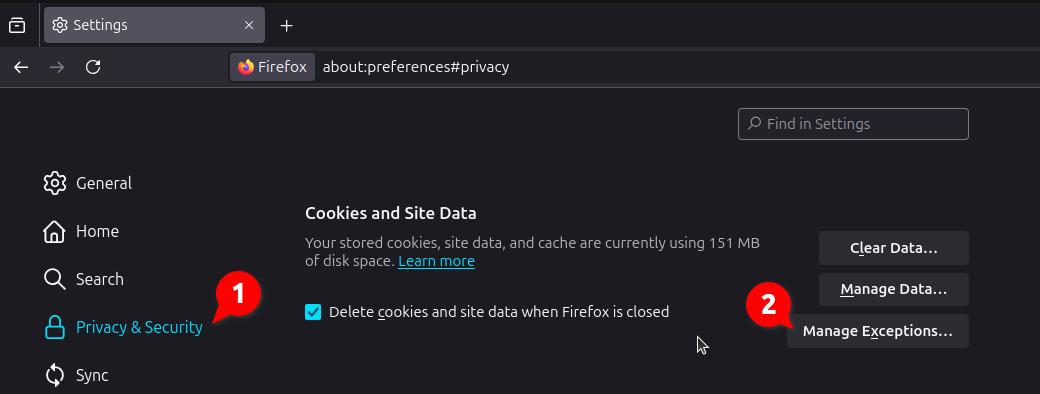
If the checkbox "Delete cookies and site data when Firefox is closed" is checked, the "local storage" will be deleted when the browser is closed, and the above-mentioned case may occur. It is recommended to add an exception for the application (domain).
The WebPQ service can be started via the command line with the --console extension. This option displays all log outputs directly in the console instead of being saved in a separate log file. This can be particularly useful for monitoring errors or important system messages in real-time and quickly responding to issues. Administrators or developers can immediately see which processes are running in the background and intervene if necessary.
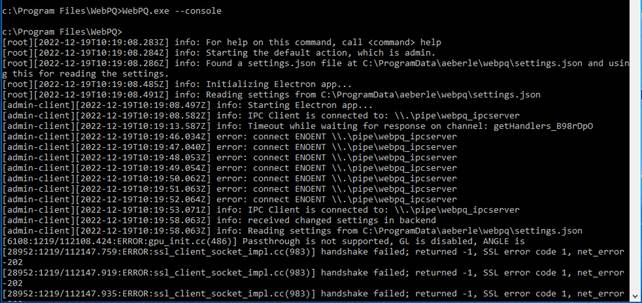
The WebPQ application logs all events of the various processes by default in the directory specified in the WebPQ backend.
By default, the log directory can be found under Windows here:C:\ProgramData\aeberle\webpq\logs
WebPQ distinguishes the following log types:
WebPQService.err.log
→ Contains log entries of the Windows service
Folder Services
→ Contains logs of the various processes within the application
Folder audit
→ Stores auditable events, such as:
User logins to the system
Incorrect password entries
Changes to user and rights management
These audit logs serve traceability and security by documenting all relevant changes and activities in the system.
To limit the number of stored logfiles, a maximum retention period in days for logging can be set in the system.
settings.jsonThe settings for the logfile retention period are located in the settings.json file.
By default, logfiles are stored for 50 days.
The relevant parameter for limiting is:
"pruneLogsAfterDays": 50
The WebPQ service must be restarted once on the server to activate the setting.
To also access the logfiles on the client, there is an option in the "Syslog" section to download all logfiles from the system.
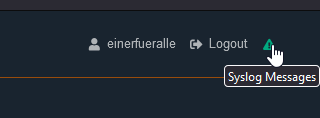
By clicking the "Download Logfiles" button, all logfiles can be downloaded directly from the system. Additionally, a special logfile with user-specific information can be downloaded via the "Download Audit Logfiles" button.
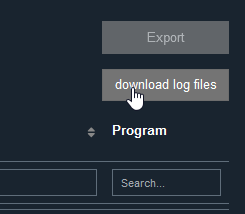
| The availability of the "Download Audit Logfiles" button depends on the user rights. Depending on the permission, the button may be shown or hidden. |
| Note |
By default, WebPQ sends additional HTTP security headers that prevent the application from being embedded in a third-party iframe. This is the secure default and primarily protects against clickjacking.
For special on-premise scenarios, embedding can be adjusted through the settings.json file if required.
The relevant parameter is:
"allowEmbeddingInIframe": false | "same-origin" | true
Example in the settings.json file:
"http": {
  "httpAccessLogging": false,
  "allowEmbeddingInIframe": "same-origin"
}
Notes:
The default value is false, which sends X-Frame-Options: DENY and Content-Security-Policy: frame-ancestors 'none'.
The value "same-origin" sends X-Frame-Options: SAMEORIGIN and Content-Security-Policy: frame-ancestors 'self'.
The value true removes the framing restrictions and should only be used if WebPQ must be embedded in a trusted parent application from another origin.
After changing the setting, the WebPQ service must be restarted on the server.
WebPQ can additionally send the Strict-Transport-Security header. This instructs browsers to keep using HTTPS for the application for a longer period after the header has been received once.
The relevant parameter is:
"strictTransportSecurity": true
Example in the settings.json file:
"reverseProxy": {
  "https": {
    "strictTransportSecurity": true
  }
},
"http": {
  "httpAccessLogging": false,
  "allowEmbeddingInIframe": false
}
Notes:
The standard on-premise HTTPS-only defaults enable this setting.
This setting should only remain enabled when the installation is intended to stay HTTPS-only.
If HTTP and HTTPS are both enabled, WebPQ will not emit the HSTS header even when this setting is true.
If browsers have already cached HSTS and you want to allow HTTP again later, keep HTTPS reachable until the cached browser state has expired or has been cleared intentionally.
This section describes the manual migration of an existing WebPQ installation from a source system A to a target system B.
The guide is intended for on-premise Windows installations when the migration should be performed in a controlled step-by-step way.
Clarify these points before the move
Before the actual migration starts, at least the following points should be clear:
Where is the active settings.json located on system A?
Which paths are configured there for data, exports, logs, or other WebPQ content?
Is the same WebPQ version and the same database version installed on system B as on system A?
Is the database running locally on system A?
Is the Master Encryption Key from system A available?
Are certificates, private keys, or special credentials documented separately?
Typical default values are:
settings.json: C:\ProgramData\aeberle\webpq\settings.json
WebPQ service: WebPQService
local database: WebPQDatabase
If services are stopped or started from the Windows command prompt, the cmd window must be opened as Administrator.
Step 1: Identify system A
Identify the active settings.json on system A.
List all relevant folders referenced from settings.json.
Check whether WebPQDatabase exists locally or whether an external database is used.
Make the Master Encryption Key from system A available for later entry on system B.
Step 2: Stop the services on system A
Stop WebPQService.
If present locally, stop WebPQDatabase.
Make sure that no other process is still writing into the folders that will be copied.
Example in a Windows command prompt started as Administrator:
net stop WebPQService
net stop WebPQDatabase
This helps avoid copying an inconsistent system state.
Step 3: Back up the data from system A
The following content should be copied 1:1:
settings.json
the WebPQ folders referenced in settings.json
if present locally, the PostgreSQL data folder of the WebPQDatabase instance
A clearly structured transfer folder or ZIP package is recommended so that nothing is missed on system B.
Step 4: Prepare system B
Install WebPQ on system B.
Verify that the required services exist on system B.
Stop existing WebPQ services on system B.
Ensure that sufficient permissions and free disk space are available on the target paths.
Example in a Windows command prompt started as Administrator:
net stop WebPQService
net stop WebPQDatabase
Step 5: Copy the data to system B
Copy the backed-up settings.json to the intended location on system B.
Copy the backed-up WebPQ folders to their target locations.
If the database is local, copy the PostgreSQL data folder to the database path on system B.
If the folder structure differs on system B, the path entries in settings.json must be adjusted accordingly.
Step 6: Set the Master Encryption Key on system B
The Master Encryption Key must be transferred into the settings.json on system B.
The relevant entry is:
masterEncryptionKey.plain
This is required so that migrated data can be decrypted correctly on system B.
Step 7: Check additional topics
Before the first startup on system B, also verify:
certificates and private keys
database credentials
permissions on folders and files
network shares or UNC paths
host names, firewall rules, or reverse proxy settings
Step 8: Start the services on system B
If present locally, start WebPQDatabase first.
Then start WebPQService.
Test the basic availability and functionality of WebPQ.
Example in a Windows command prompt started as Administrator:
net start WebPQDatabase
net start WebPQService
Step 9: Verify the system after the move
After starting system B, at least the following checks should be performed:
does WebPQ start without error messages
is historical data visible
can new data be processed
do exports, logs, and background processes work
are there any indications of missing certificates or decryption problems
Typical issues after the move
The Master Encryption Key was not transferred
In this case, some data on system B cannot be decrypted correctly.
The database data was not moved
In this case, the application may start, but historical data is missing.
The paths in settings.json do not match system B
In this case, data folders, export paths, or other content cannot be found.
Certificates or keys are missing
In this case, encrypted connections or external integrations may fail after the migration.
In practice, there are three useful backup strategies for WebPQ. The right option mainly depends on whether the installation is intended to be simple or highly resilient.
This option is especially suitable for simple installations where the WebPQ application is installed on drive C: and the database is installed on drive D: of the same virtual machine.
In this setup, the complete virtual machine is backed up including all attached disks. This means the backup contains the operating system, the WebPQ installation, configuration, user data, certificates, and the database on drive D: together.
Advantages:
Very simple recovery if the complete machine fails.
The complete system configuration remains available in one consistent backup.
Well suited when recovery on the same or a new hypervisor should be completed quickly.
Notes:
Make sure that the VM backup really includes all disks relevant to WebPQ, especially the data disk D:.
A VM snapshot or VM backup does not replace a planned retention strategy with multiple restore points.
Before updates or major system changes, an additional dedicated backup point should be created.
For many production systems, this is the recommended standard approach. In this model, the machine or virtual machine is backed up and the database is additionally protected by its own database backup concept.
The advantage is that the system environment and the database can be restored separately. This makes it possible, for example, to restore a server to a known-good state while recovering the database from a newer or specifically selected backup point.
This concept usually includes:
Backup of the WebPQ machine or the WebPQ system partition.
Regular PostgreSQL backups with defined retention.
Separate backup of important configuration files, certificates, licenses, and keys.
This option is usually more robust than relying on a machine backup alone because logical database errors or accidental changes can be corrected more precisely.
For installations with higher availability requirements and short downtime targets, an advanced concept with an additional PostgreSQL backup mirror via streaming replication and complementary classic backups is recommended.
In this model, the existing backup mirror is operated as a continuously updated copy of the production database. In an emergency, the backup server can be promoted to the new primary server. The setup details are described in the installation chapter under PostgreSQL Backup Mirror with Streaming Replication.
The important point is:
Replication increases resilience.
Replication does not replace classic database backups.
Regular database backups are still required for older restore points and protection against operator errors.
This option is the best basis when restoration should be possible within a few hours or faster.
An existing automatic backup via WinPQ can still be useful, especially for device parameters or device-specific configurations. However, it should not be treated as the only strategy for the complete restoration of a WebPQ system.
For full restoration, at least the server or VM backup, the database backup, and the backup of relevant configuration and key material are also required.
Fast and complete restoration requires not only a backup itself but also a clear restore procedure.
The recommended approach is:
Choose a backup strategy that allows the operating system, the WebPQ application, the database, and the configuration data to be restored together or in a coordinated way.
Ensure that certificates, license information, passwords, connection data, and exported keys are stored securely in addition to the database contents.
Perform test restores regularly so that no unknown steps remain in a real emergency.
Store backups outside the productive server or datacenter so that they remain available even in the event of hardware failure or site damage.
Depending on the selected strategy, the typical restore path is as follows:
With option 1, the complete virtual machine is restored from the last consistent backup or snapshot.
With option 2, the machine or server is restored first and then the database is recovered from the planned PostgreSQL backup.
With option 3, the preferred emergency path is to switch to the replication server first and rebuild the original primary server afterward.
For minimum downtime, option 3 is usually the best choice. For smaller or simpler installations, option 2 is usually the best compromise between effort, safety, and recovery time. Option 1 is practical for simple single-server installations, provided that all relevant disks and configuration data are really included in the VM backup.
The application you are using requires certificates and keys in PEM format (Privacy-Enhanced Mail). PEM is a standardized format for storing and transmitting cryptographic data, such as certificates, private keys, and public keys.
What is the PEM format?
The PEM format is a text format that encodes cryptographic data and represents it as Base64-encoded strings. These data are surrounded by "Begin" and "End" markers to denote the different types of cryptographic information.
Example:
A certificate in PEM format looks like this:
-----BEGIN CERTIFICATE----- MIIDdzCCAl+gAwIBAgIEU1mW... ...klrjDffKwF2MnPxgt1h0DA== -----END CERTIFICATE-----
A private key in PEM format looks like this:
-----BEGIN PRIVATE KEY----- MIIEvgIBADANBgkqhkiG9w0BAQEFAASCBKgwggSkAgEAAoIBAQ... ...jJTZMOyPyjxVrM52mf6w== -----END PRIVATE KEY-----
Why PEM?
The PEM format is often used because it is easily readable and simple to handle. It allows for easy storage of certificates and keys in a text file that can be used in various applications and servers. How to use certificates and keys in PEM format?
Provide certificates and keys: Ensure that you have received the appropriate certificates and keys in PEM format. These are usually provided by a Certificate Authority (CA) or your IT security system.
Embed files: To use the certificates and keys in your application, you need to insert them into the appropriate configuration files or specify the path to the files in the application settings.
Observe security: Ensure that private keys are stored securely. They should never be placed in insecure areas or made accessible to unauthorized users. The private key can also be protected with a password passphrase to provide additional security.
Encryption:
If the key in PEM format is encrypted, a password can be entered in the application to decrypt and use the key.
Example:
An encrypted private key in PEM format might look like this:
-----BEGIN ENCRYPTED PRIVATE KEY----- MIIEpAIBAAKCAQEA7JzQ+opZX7bPmnB6BBQ5mQgCvZvXq4bD8+Gm3kmK2b7HLkn7 ... -----END ENCRYPTED PRIVATE KEY-----
In this case, the private key is encrypted with a passphrase. When someone tries to access this key, they will be prompted to enter the passphrase to enable decryption.
Common Issues:
Incorrect Format: If the certificate or key is not in the correct PEM format, the application may not accept it. Make sure you have received the files correctly.
Invalid or Expired Certificates: Check the expiration date and validity of the certificate to ensure it is still valid.
If you have any further questions regarding certificates or keys in PEM format, please contact support.
The WebPQ software is continuously developed. Within the license period of 12 months, updates are free of charge and can be downloaded directly from the homepage
www.a-eberle.de.
It is recommended to always install the latest version to close security gaps and take advantage of new features. For patch management, A. Eberle GmbH provides a customer portal:
https://www.a-eberle.de/news/anmeldung-kundenportal/
The update can be installed directly via the installation routine. Administrative rights are required for this.
To install the update, proceed as follows:
Download the latest file from the homepage www.a-eberle.de.
Start the installation routine.
Follow the instructions of the installation wizard.
Restart the software to apply the changes.
If the update entitlement of the currently stored license has expired, the installed system can still continue to run, but newer updates require a renewed license or maintenance extension.
If the installer or the running system requests a new license, load the renewed JSON license and complete activation again if WebPQ asks for it.
| Back up your database before each update to avoid data loss! |
| Note |
If the database is operated via PostgreSQL, you can back up the database as follows:
Open the pgAdmin program.
Right-click on the database.
Select Backup.
Choose the storage location and confirm with OK.
A continuously updated PostgreSQL backup mirror using streaming replication can increase resilience further. However, this replication does not replace a classic backup before updates. For production systems, it is recommended to combine a replication server with additional regular database backups. An example setup of the backup mirror is described in the installation chapter under PostgreSQL Backup Mirror with Streaming Replication.
If you have problems or questions, please contact A. Eberle Support:
Service Address:
A. Eberle GmbH & Co KG
Frankenstraße 160
D-90461 Nuremberg
Regular updates ensure the security and optimal performance of the software.
A. Eberle guarantees that this product will remain updatable for a period of 12 months from the date of purchase.
The warranty does not cover damages caused by the following:
Accidents
Misuse
Abnormal operating conditions
To claim the warranty, please contact A. Eberle GmbH & Co. KG in Nuremberg.
A. Eberle GmbH & Co. KG
Frankenstraße 160
D-90461 Nuremberg
Tel.: +49 (0) 911 / 62 81 08-0
Fax: +49 (0) 911 / 62 81 08 99
E-Mail: info@a-eberle.de
Note: The following pages contain the release notes for the WebPQ software and the REST API. Please note that these release notes may not always reflect the current state of the software version. With software updates, it may happen that the present description is no longer accurate in some points. In this case, please contact us directly or use the latest version of the release notes, which you can find on our website www.a-eberle.de.
Publisher:
A. Eberle GmbH & Co. KG
Frankenstraße 160
D-90461 Nürnberg
| Device Type | DSP / Hardware | Inputs | Firmware Version / Date | Notes |
|---|---|---|---|---|
| PQI-D(A) | DSP 100 MHz | 8 voltage inputs | 2.1.03 (02.06.2021) | |
| PQI-D(A) | DSP 100 MHz | 4 current, 4 voltage | 3.1.01 (07.05.2014) | |
| PQI-D(A) | DSP 200 MHz | 8 voltage inputs | 4.0.07 (10.05.2011) | |
| PQI-D(A) | DSP 200 MHz | 4 current, 4 voltage | 5.0.16 (09.04.2014) | |
| PQI-D(A) | DSP 300 MHz | 4 current, 4 voltage | 7.0.04 (07.07.2015) | |
| PQI-DA smart | Gen 1, 2, 3 | 4 current, 4 voltage | >= 3.4.4 | Web server enabled |
| PQI-DE | Gen 1, 2, 3 | 4 current, 4 voltage | >= 3.4.4 | Web server enabled |
| PQI-LV | Gen 1, 2, 3 | 4 current, 4 voltage | >= 3.4.4 | Web server enabled |
Patches for the deployed PostgreSQL database are provided via a separate update process. You can find the latest patches in the download center under "WinPQ" in the "PostgreSQL Patches" section, as well as in the program directory under /PostgreSQL Update/ in the update folder of the WebPQ installation. The full version of the WebPQ system software always includes the latest database version available at the time of release.
Starting with this update, it is recommended to use PostgreSQL v18.2.
News, Features, and Improvements
[#10484] Existing PQID connections can be reused when adding additional PQID devices.
[#10856] PQID devices can be created more reliably from existing connections.
[#10831] Additional long-term data classes from PQID files are now included during import.
News, Features, and Improvements
[#10683] New COMTRADE exports can select fault records explicitly.
[#10810] COMTRADE exports automatically remove fault records that no longer match when devices are deselected.
[#10360] Exports can be recreated when an export run needs to be repeated.
[#10384] Multiple users can be deleted in a single operation.
[#10440] PQID connections from rs232server.ini can be selected and deselected before scanning.
[#10361] PQID module and native PQID helper messages are routed into WebPQ logging.
[#10098] Expired demo licenses block normal startup and let authorized users directly import a replacement license.
[#10616] PQID long-term data import avoids duplicate data, converts raw status values correctly, and continues readout more reliably.
[#10636] Linking existing PQID devices reconciles measurement tables with the pqidata metadata.
[#10247] Fault-record import avoids duplicate tabname/recid combinations in historically inconsistent data sets.
[#10694] Landscape fault-record reports are readable again.
[#10695] Fixed colors are respected correctly when exporting fault-record PDFs.
[#10627] Application startup no longer opens competing login dialogs.
[#10655] Cleanup of old inducements is batched and more robust for larger data sets.
[#10651] Generated Kubernetes, SaaS, and development configurations set the public application URL through externalUrl.
Security-related content and adjustments
[#10584] CVE-2026-44705, CVE-2026-44979, and CVE-2026-44974: Security fix.
[#10669] CVE-2026-34077, CVE-2026-40181, CVE-2026-42342, CVE-2026-42211, CVE-2026-33245, and CVE-2026-33244: Security fix.
[#10624] Access to current license features is now authenticated.
Primary Tracking Ticket / Topic Reference
[#9912] Documentation and summary of the main WebPQ user-facing capabilities added since w-2.1.1. No separately labeled epic issues for 2.2.0 could be identified for this version, so the overarching tracking ticket is used as the reference.
News, Features, and Improvements
PQI-D support: Support for PQI-D devices has been extended. This includes creating PQI-D devices, taking over detected device data, and supporting readout operations for PQI-D devices.
WinPQ device import: Importing existing WinPQ devices was expanded and aligned more closely with the current device management.
PQ-Box integration: PQ-Box data can now be integrated into WebPQ with shared data class logic and clearer assignment behavior.
COMTRADE import: COMTRADE import is available as its own import path and covers add-on visibility, device assignment, supported file groups, and import logging.
Map View: Map View was expanded functionally and made clearer to use for setup, filtering, and navigation.
Group dashboards: Shared dashboards for groups were extended so content can be shared and maintained in a more structured way.
Language support: The supported user interface languages were extended or updated further. This broadens WebPQ's suitability for international use.
FFT analysis: FFT analysis was expanded for both historical data and live data.
Custom-threshold utilization analysis: The utilization analysis for custom thresholds was extended and integrated more clearly into the analysis area.
DFR and PQ events: Working with disturbance records and PQ events was improved in selection, evaluation, and follow-up processing.
Analysis dashboard copy and paste: Copied dashboard tabs can be pasted as selectable analyses, and pasted single-analysis JSON can create a new dashboard tab.
Automation tasks: Automation tasks can now address devices both directly and through tags and tag categories.
Reporting and printing: Reports and print outputs respect tenant-specific logos and page formats.
Export system: Automated exports appear in the same export overview as manual exports.
Data Synchronization (OT / IT Bridge): Synchronization between OT and IT systems was documented more precisely under the product name OT / IT Bridge.
OAuth login: OAuth login was extended for current sign-in and consent processes.
License activation: License activation was aligned with the current product state, including grace-period and reactivation behavior.
Device settings and parameterization: Device metadata handling, connection tests, time-zone recalculation, and schema-based parameter editors were improved further. For PQ Smart, the import/export behavior and the handling of transformer factors were also extended.
Swagger/OpenAPI for administrators: Administrative access to Swagger/OpenAPI was clarified and aligned with the current security model.
Additional Important Enhancements
Export management: Exports that are not yet completed are cleaned up, while older exports that were already completed remain available and can still be downloaded.
COMTRADE import: Warnings, failure cases, and the integration of COMTRADE import into the general import area were extended.
Export diagnostics: Failed exports can be traced in the export area and through matching Syslog entries.
ParaExpress parameterization:PQI-DA and PQI-D devices can now be parameterized directly from within the application by using a dedicated ParaExpress.exe. This path is available for all firmware versions.
Important Bug Fixes
Printing and reports: Pagination in PDF reports works correctly again, and reports are generated only after the required report elements have fully loaded.
Automation tasks: Historical disturbance records are sent reliably again after changes to the device time settings.
Export operations: The traceability of failed exports in the export area and through matching Syslog entries was improved. This simplifies root-cause analysis during operation.
Analysis dashboard JSON paste: Invalid or unreadable pasted JSON is now reported directly in the paste dialog, and copied tab intervals are preserved when analyses are imported into another tab.
Security-related Content and Adjustments
Applicable or release-relevant security issues:
[#9729] CVE-2026-33894: classified as a release-relevant security fix related to certificate validation.
[#9872] GHSA-6v7q-wjvx-w8wg: relevant security fix for a runtime dependency used by WebPQ.
Not applicable or not release-relevant security issues:
[#9726] CVE-2026-33895: not release relevant because the affected Ed25519 verification path is not used in WebPQ.
[#9728] CVE-2026-33891: not release relevant because no reachable code path was found where untrusted zero input reaches BigInteger.modInverse().
[#9730] CVE-2026-33896: not release relevant because pki.verifyCertificateChain() is not used in WebPQ and trust checks rely on X509Certificate.verify.
Security-related content and adjustments
Non -critical security issues fixed in this release:
[#9801] CVE-2026-35042 - Security fix
[#9802] CVE-2026-34950 - Security fix
[#9872] GHSA-6v7q-wjvx-w8wg - Security fix
News, Features, and Improvements
[#9513] Initialization/Migration command-line script added for migration of Docker containers
[#9508] Docker image tags extended with release branch prefix
[#9593] License activation optimized after license update or license upgrade
[#9459] Error when deleting devices fixed – statement timeout optimized
Security-related content and adjustments
[#9627] CVE-2026-33036: Security fix - Severity: Medium (4.9) - see Security Advisories
[#9729] CVE-2026-33894: Security fix - Severity: Low - see Security Advisories
Non-critical security issues fixed in this release:
[#9402] CVE-2026-27837: Security fix
[#9426] CVE-2026-2359: Security fix
[#9425] CVE-2026-3304: Security fix
[#9453] GHSA-qffp-2rhf-9h96: Security fix
[#9462] CVE-2026-3520: Security fix
[#9463] CVE-2026-27601: Security fix
[#9464] CVE-2026-29063: Security fix
[#9549] CVE-2026-27904: Security fix
[#9551] CVE-2026-27903: Security fix
[#9550] CVE-2026-31808: Security fix
[#9550] CVE-2026-30951: Security fix
[#9550] CVE-2026-31802: Security fix
[#9580] CVE-2026-32630: Security fix
[#9651] CVE-2026-33349: Security fix
[#9704] CVE-2026-33672: Security fix
[#9706] CVE-2026-33671: Security fix
[#9731] CVE-2026-33916: Security fix
[#9732] GHSA-c7w3-x93f-qmm8: Security fix
[#9727] CVE-2026-33750: Security fix
[#9728] CVE-2026-33891: Security fix
[#9726] CVE-2026-33895: Security fix
[#9730] CVE-2026-33896: Security fix
News, Features, and Improvements
[#9383] Device counting routine for license check optimized for UU devices
[#9293] API license check for REST API optimized
[#9328] Improvements in measurement values during import with infinity values
Security-related content and adjustments
[#9281] CVE-2026-2003: PostgreSQL oidvector discloses a few bytes of memorysecurity-fix
[#9282] CVE-2026-2004: PostgreSQL intarray missing validation of type of input to selectivity estimator executes arbitrary codesecurity-fix
[#9283] CVE-2026-2005: PostgreSQL pgcrypto heap buffer overflow executes arbitrary codesecurity-fix
[#9285] CVE-2026-2006: PostgreSQL missing validation of multibyte character length executes arbitrary codesecurity-fix
[#9286] CVE-2026-2007: PostgreSQL pg_trgm heap buffer overflow writes pattern onto server memorysecurity-fix
News, Features, and Improvements
[#8927] Fixed creation of custom threshold group automation tasks.
[#8799] Printing: Fixed pagination.
[#6357] Automation tasks: Send historical recordings after a device time setting change.
[#8980] Syslog: Truncate entry strings to valid lengths.
[#9001] PQSmart: “filelink” parameters can be saved again.
[#8884] Tag settings: Corrected link target.
[#9089] Modbus clients: Time zone is no longer required.
[#9098] Updated language files for China and France as well as German and English
[#9090] PQI-DA smart Parameter - Transformer factor: Support negative sign.
Security-related content and adjustments
All None critical security issues have been fixed in this release:
[#8986] Security update: Fixed CVE-2025-65945 and CVE-2025-13466.
[#9049] Security update: Fixed CVE-2025-15284.
[#9050] Security update: Fixed CVE-2025-59057, CVE-2026-22029, CVE-2026-21884, CVE-2026-22030, and CVE-2025-68470.
[#9122] Security update: Fixed CVE-2026-23950.
News, Features, and Improvements
[#8905] Connections with zeros in IP addresses are processed correctly
[#8903] Security update: Fixed CVE-2025-12758 (Severity: Low)
[#8889] Security update: Fixed CVE-2025-66400 (Severity: Low)
[#8888] Security update: Fixed CVE-2025-64756 (Severity: Low)
[#8888] Import of event files with invalid data made more robust
[#8797] Added progress indicator for database migration
[#8722] Automation tasks: Devices can be selected without a template
[#8922] Fixed an issue with the article numbers of PQI-DE devices. Parameters are now reliably and correctly stored in the device templates.
News, Features, and Improvements
[#8725] Improved navigation when leaving the dashboard view (routing)
[#8733] Optimized migration logic for dashboard widgets
[#8820] Live data tile view: Improved selection of measurement data after logout/login
Security-related content and adjustments
[#8838] Security updates: Fixed vulnerabilities CVE-2025-12816, CVE-2025-66031, and CVE-2025-66030
News, Features, and Improvements
LDAP Authentication: WebPQ now supports LDAP authentication, enabling seamless integration with enterprise-wide identity management systems for secure and centralized user access.
Microsoft SQL Database Support: WebPQ now supports Microsoft SQL databases, expanding deployment options and integration into existing IT infrastructures.
PQDIf Export (IEEE 1159): Disturbance records and long-term data can now be exported in PQDIf format according to IEEE 1159—both as an automation task and manually. This ensures compatibility with third-party systems and simplifies data exchange.
Custom Thresholds for Monitoring & Automation: Define your own thresholds for monitoring and automation tasks to enable tailored monitoring and automated responses to specific operational requirements.
FRT Curves: New Fault Ride Through (FRT) curves for analysis and evaluation of grid codes worldwide according to current standards. Includes VDE-AR4110, VDE-AR4120 Type 1 and Type 2, and international grid codes.
Live Data Tile View: A new hierarchical tile view for live data provides an intuitive overview of devices and their status for faster decisions, optimized workflows, and simplified navigation.
Syslog Event Log: Track and audit reading processes via the integrated Syslog event log for greater transparency and compliance in system operations.
Optimized Performance for Large Installations: Significant improvements in reading processes deliver more speed and scalability for large installations.
Extended Language Support: WebPQ now offers comprehensive language updates and supports Spanish, French, Italian, Polish, Dutch, Chinese, and more—for worldwide deployment.
Graphical Editor for Parameterization: A powerful, redesigned graphical editor for device parameters simplifies configuration. Improved support for SCADA, MQTT, P-Sense, and new device templates included.
License Activation & Dongle Mechanism: Enhanced license management with a new activation and dongle mechanism.
Numerous Improvements & Bug Fixes: This major release includes a wide range of optimizations and bug fixes that further increase stability, reliability, and user experience.
Security-related Content and Adjustments
All libraries have been updated to the latest versions at release to close security gaps and ensure system stability (Electron, backend, frontend).
News, Features, and Improvements
[#8071] Fixed issue with empty disturbance record PDFs when server time is ahead of device time.
[#7989] Statistics are now calculated more efficiently to reduce system load.
[#7902] Automation tasks with a large number of executions can now also be deleted.
[#7887] Fixed error in connection data when importing WinPQ devices.
[#7875] Logfiles can now be read correctly again; duplicate EOF markers are ignored.
[#7866] Connection interruptions are now properly caught and handled.
[#7814] Fixed error when loading the live level time diagram.
[#7854] Automation tasks are now retained when upgrading from version 2.0.9 to 2.0.10.
[#7729] Users can now be deleted even when many executions exist for automation tasks.
[#7714] Unauthorized users no longer see devices in settings or automation tasks.
[#7691] Heap dump display has been removed from the user interface.
[#7773] The disturbance record list now correctly includes Sundays during daylight saving time changes.
[#7781] The progress bar in the analysis cockpit no longer gets stuck.
[#7611] The configured COM interface for DCF time signals has been corrected.
News, Features, and Improvements
[#7696] IEC61000-2-4 standard templates for devices and the system have been updated to the latest version.
[#7727] Logging improved – logging is now reliably performed even with limited storage.
[#7679] WebPQ interface languages updated for even easier operation.
[#7667] “Dirty check” now detects changes to standard templates more reliably.
[#7672] Windows service prevents duplicate execution in complex system environments.
[#7680] Reports for devices >150 kV are now generated correctly.
[#7641] Axis labels in time diagrams in reporting are now clearer.
[#7664] SSH tunnel with keep-alive for faster response to connection interruptions.
[#7691] Heap dump function introduced in the backend to diagnose memory issues more easily and quickly.
Security-related content and adjustments
[#7762] fixes CVE-2025-7338
News, Features, and Improvements
[#7630] Added logging of heap limits for specific Windows systems to monitor system performance.
[#7575] Improved the display of measurement values for NaN values to allow the display of maximum values.
[#7499] Improvements in the permission management of automation tasks.
[#7632] The time zone settings for devices have been made mandatory to ensure consistent time zone processing.
News, Features, and Improvements
[#7592] The Electron app now uses memory more efficiently to ensure stable and reliable usage.
[#7536] Statistics calculation is now based on UTC time to provide a consistent time basis.
[#7416] PQI-D devices are now reliably considered in alarming via automation tasks.
[#7419] Live values are displayed without restrictions in the latest Firefox browser.
News, Features, and Improvements
[#7534] The number of database accesses during statistics calculation has been further reduced to improve performance.
[#7512] Improvements in handling time zones: Data is now processed correctly even for devices without a set time zone.
[#7539] Statistics calculation now also considers devices in the current week with expired quantiles.
[#7533] The import of measurement data has been optimized, requiring fewer database accesses.
Security-related content and adjustments
[#7463] Security update: The Multer component has been updated to version 2.0.1.
News, Features, and Improvements
[#7314] The performance of statistics calculation during the import of measurement data has been further improved by reducing parallel accesses.
[#7429] System performance on systems with SATA hard drives has been increased through targeted optimizations.
[#7435] Managing many measuring devices in the configuration of automation tasks has been simplified and accelerated.
[#7232] The report sending function has been extended so that reports can now also be sent to recipients outside the system.
News, Features, and Improvements
[#7314] Optimized data reduction when reading measurement data during import by checking timestamps.
[#7316] Optimized data point limitation in the display of measurement data.
[#7276] Updated C runtime DLLs for the installation of the PostgreSQL database.
[#7215] Installer – improved restrictions for installation in existing system environments.
[#7242] SSH tunnel error handling optimized for unstable connections.
[#7162] Optimized REGEX for entering limit values in harmonics.
Security-related content and adjustments
[#6195] All libraries have been updated.
[#7328] PostgreSQL connection – SSL settings were not correctly applied (see Security Advisories for details).
[#7347] Denial of Service due to memory leaks from unclosed streams in Upload Tenant, Import, and Fleet Management – CVE-2025-47935 & CVE-2025-47944 (see Security Advisories for details).
News, Features, and Improvements
[#7160] Improved export of disturbance records as PDF.
[#7141] Optimized triggers for PQI-D database tables.
[#7126] WinPQ device integration – optimization of automatic import.
[#6334] Increased the number of analyses in reports.
=======
News, Features, and Improvements
[#7085] Optimization when creating reports – migration is now performed before report generation.
[#7068] Added migration of existing binary data tables from WinPQ.
[#7023] Improvements in fleet management – optimized license management.
[#6984] Adjustment of the greeting text in emails to match the respective license version.
[#6983] Optimization of routing.
[#6979] Fixed an issue with duplicate loading of the report preview – the preview is now loaded only once.
[#6967] Added display of missing harmonic numbers for PQ events.
[#6900] Fixed an issue with analysis tabs – deleting a single tab now reliably removes the placeholder in the window.
[#6957] Fixed an issue with printing due to self-signed certificates in connection with images.
[#6743] Improved device parameter templates – templates that were previously incompatible have been adjusted.
[#7097] Fixed issues with recId as BigInt columns in Creca/Crecb tables from existing WinPQ databases with different DB schemas.
[#6958] Fixed an error when saving changes without an active SMTP server.
[#7044] Stabilized the reading of measurement data for devices with poor QoS.
News, Features, and Improvements
[#6939] Optimized routing for disturbance records from the network overview.
[#6884] Level-time diagram – X-axis labeling has been optimized.
[#6880] Added an option to disable the validity check of certificates from external SMTP servers.
[#6875] Optimized saving of analysis via the dashboard.
[#6874] Removed the "Show Hierarchy" button in Historical Data Power Quality.
[#6873] Optimized linking of live data to the Analysis Cockpit for supraharmonics.
[#6829] Improved dirty check for SMTP configurations.
[#6897] Enabled parallel upload to the database – parameter activated.
Security-related content and adjustments
[#6195] All libraries have been updated.
News, Features, and Improvements
[#6814 / #6804 / #6747 / #6711 / #6494 / #6746 / #6816] Translations and documentations updated
[#6780] Email is again sent to CC & BCC recipients
[#6774] The relative time setting is now retained after "reset zoom" in the chart.
[#6756] The live data display under Analysis/Devices has been improved.
[#6755] The creation of an SSH device with Radius authentication has been optimized.
[#6753] The WinPQ Device Wizard now initializes correctly.
[#6745] The "Compare with other parameter sets" function works again.
[#6742] Binary inputs are now correctly adapted to the device classes in the live data.
[#6735] The "Show hierarchy" button is available again in the device dialog.
[#6718] The pop-up menu associated with the export now works reliably. The disturbance records window has been revised.
[#6677] The settings for logging on the device synchronization page have been improved.
[#6614] The device labels in the live displays have been made clearer.
[#6598] The firmware version is now correctly adopted when reading PQI-DA smart devices.
[#6597] Improved error messages for exports and printing.
[#6551] In the date dialog of the analysis, the input of a comma is now allowed.
[#6499] The manual export now works even after switching from CSV to Nequal and back.
[#6474] Expired passwords no longer affect exports.
[#6431] The time zone has been added to the logging during data import.
[#6400] Improvements in memory handling during parameterization and uploading to the server.
Security-related content and adjustments
[#6195] All libraries have been updated
API Changes
The API has been restricted to its public part and adapted to a versioning scheme. As a result, the endpoint paths have changed. See below for each endpoint.
Most endpoints that previously supported POST and GET have been mostly restricted to POST. The endpoints that query measurement data have been changed regarding the start/end dates. The start dates are now exclusive, the end dates are inclusive.
Most error responses now add a 'subCode' field that contains a general problem description such as 'NOT_AUTHORIZED' or 'INVALID_PARAMETER'. This field can be easily checked by the API client to respond accordingly.
Changes per API Endpoint
/analytics/rawtimeseries -> /api/v1/analytics/rawtimeseries
Only POST instead of POST/GET.
Parameters: The previously optional timeFormat parameter has been removed. All times are now always returned as ISO-UTC date strings. start is interpreted as exclusive, end as inclusive.
Response: The response structure remains as before, the timestamp is an ISO-UTC date string.
Runtime Aspects: The allowed query intervals have been diversified depending on the queried dataClass to allow larger intervals for data classes with lower resolution. Further details can be found in the Swagger/OpenAPI description.
/analytics/recordings -> /api/v1/analytics/recordings
Only POST.
Parameters: The previously optional serverSidePaging parameter has been removed. Start and end times are interpreted as exclusive/inclusive.
Response: The previous structure { result: row[] } has been flattened – it is now returned as { data: row[] }. In the individual rows (row), the values for device, plant, field, grouping, transnostic have been removed.
Runtime Aspects: No changes.
/analytics/getpqevents -> /api/v1/analytics/getpqevents
Only POST.
Parameters: The previously optional serverSidePaging parameter has been removed.
Response: The previous structure { result: row[] } has been flattened – it is now returned as { data: row[] }. In the individual row, the fields reca and recb are only included if there is a reference to a disturbance record. Additionally, there is a new field dataext (if available) that contains additional data depending on the event type.
/analytics/version -> /api/version
GET remains unchanged.
Parameters: No changes.
Response: No changes.
Runtime Aspects: No changes.
/authenticate/user -> /api/v1/authenticate/user
Only POST.
Parameters: An optional refresh parameter has been added, which can be ignored.
Response: No changes.
Runtime Aspects: No changes.
/master-data/user/getuser -> /api/v1/device/getdevices
This service replaces the functionality of /master-data/user/getuser to query the list of available devices. However, the structure is different from before. Here, the user is not queried, but all devices to which the calling user has access. It is important to check whether the entry userPermissions.readMeasurements.isGranted is true for a returned device before querying measurement data for that device.
Only POST.
Parameters: None.
Response: IDeviceV1[] with permissions attribute.
Runtime Aspects: No changes.
Initial version